How to Calculate ROI on Rental Property is a game-changer if you’re diving into real estate investment. Imagine you buy a cozy two-bedroom rental for $200,000, and you’re able to rent it out for $1,500 a month. That’s $18,000 a year right there. But wait! You also have expenses like property management fees, repairs, and taxes adding up to about $6,000 annually. So, what’s the actual profit? Once you crunch the numbers, it’s essential to see how much you’re really pocketing after those costs.
Now, let’s get real about those figures. From that earlier example, your net income is $12,000 a year after expenses. To figure out your Return on Investment (ROI), you’ll take that net income and divide it by the initial purchase price. So, $12,000 divided by $200,000 gives you an ROI of 6%. Simple math, right? But don’t stop there! You also might want to factor in any renovations you did to boost rental value, which can dramatically change your ROI story. Understanding these numbers not only helps you gauge how well your investment is performing but also prepares you for future decisions in the rental game.
Understanding the ROI Formula for Rentals
To make informed decisions about rental properties, understanding the Return on Investment (ROI) formula is crucial. By grasping how to calculate and interpret ROI, you can evaluate the profitability of your investments effectively.
Key Components of the ROI Formula
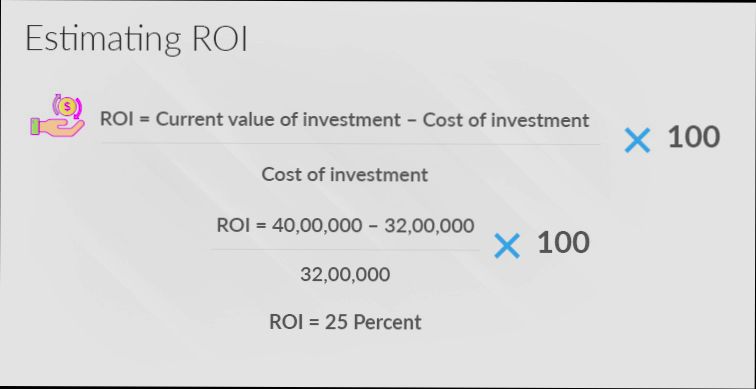
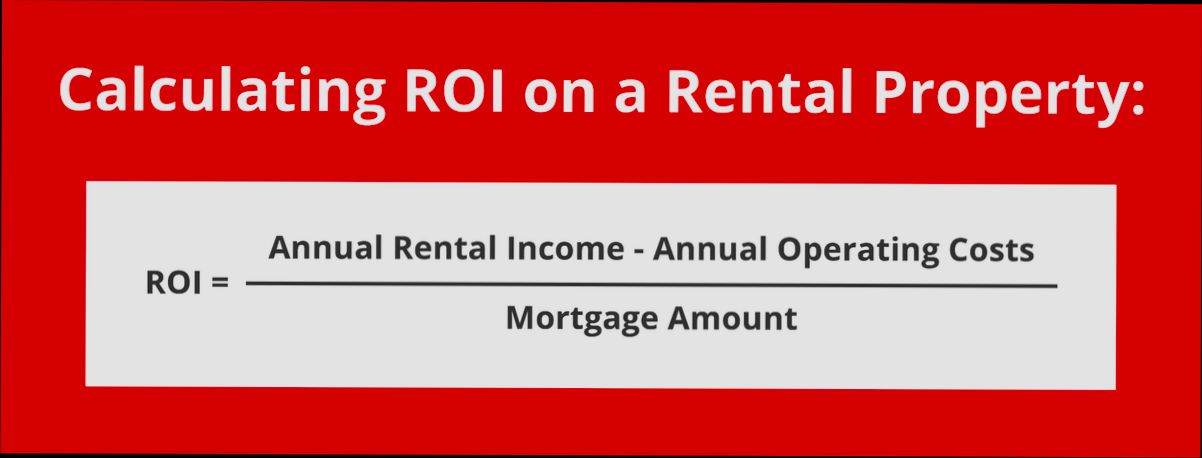
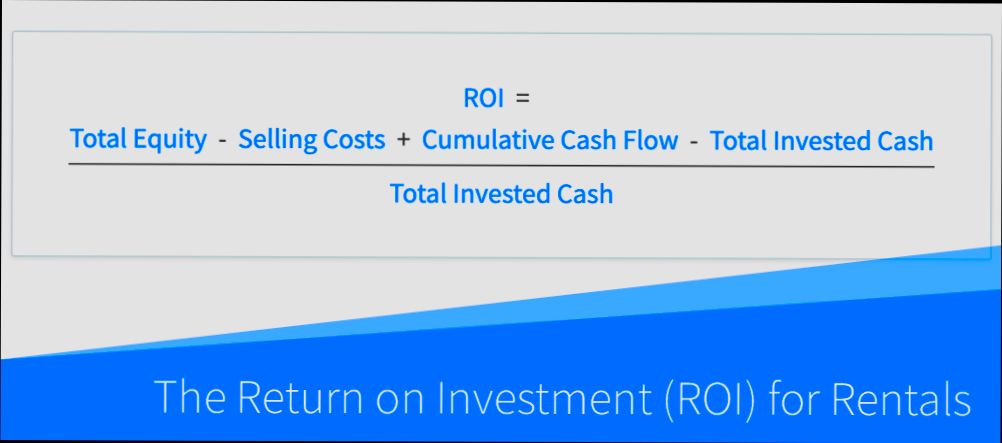
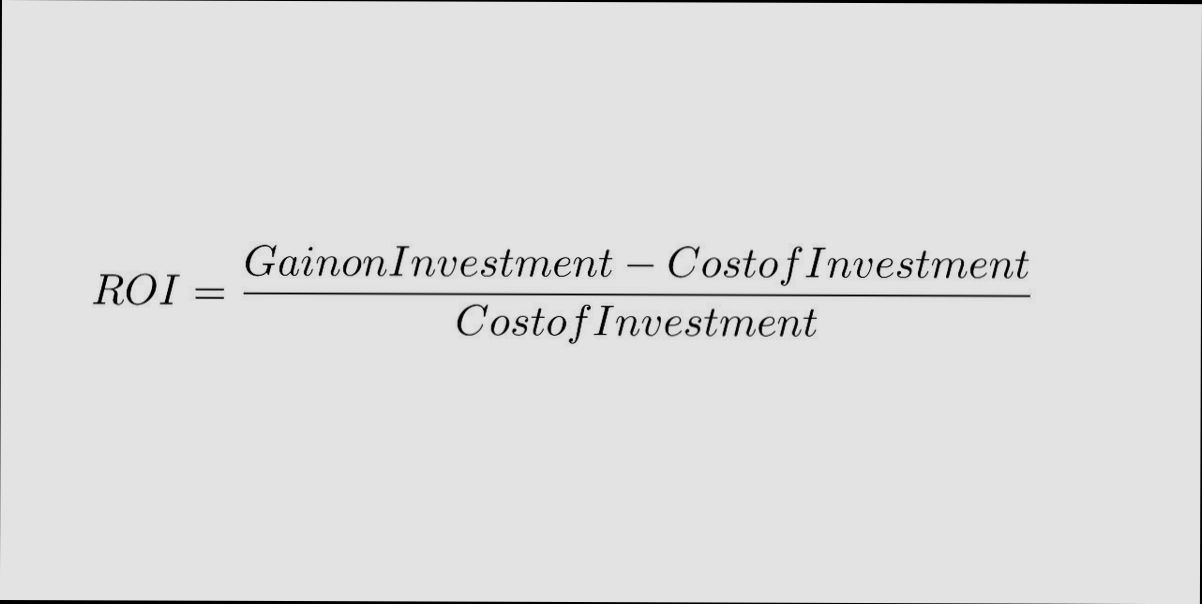
The basic formula for calculating ROI on rental properties is:
ROI = (Net Annual Income / Total Investment) × 100
Here’s how you break it down:
- Net Annual Income: This includes your rental income minus all operating expenses, such as property management fees, maintenance, taxes, and insurance.
- Total Investment: This refers to the initial outlay for purchasing the property, inclusive of closing costs, renovations, and any other direct expenditures.
It’s essential to grasp both of these components to arrive at an accurate ROI figure.
Important ROI Data Points
- Typical Rental Property ROI: On average, investors often see an ROI of approximately 8% to 12% in real estate markets.
- Impact of Financing: Using leverage can enhance ROI; for instance, a property bought with a 20% down payment and generating $15,000 in net annual income can yield an ROI of 75% or more if the total investment is only $20,000.
- Vacancy Rates: Calculating ROI accurately necessitates accounting for vacancy rates, which significantly affect net income. In many areas, a 5% vacancy rate is common, which means you should factor in that the rental property may only generate income for 95% of the year.
| Metric | Average % |
|---|---|
| Typical ROI | 8% - 12% |
| Capitalization Rate | 5% - 10% |
| Average Vacancy Rate | 5% |
Real-World Examples
Consider the case of a property in Denver purchased for $400,000. After identifying operating expenses totaling $20,000 annually, the net income stands at $30,000. Plugging these figures into the ROI formula gives:
- Total Investment = $400,000
- ROI = ($30,000 / $400,000) × 100 = 7.5%
Now let’s analyze another property, bought for $250,000 with annual costs of $10,000 and generating $35,000 in annual rental income.
- Total Investment = $250,000
- ROI = ($25,000 / $250,000) × 100 = 10%
These examples illustrate the variability in ROI based on property location, management expenses, and rental income.
Practical Implications for Investors
Understanding the ROI formula helps you make strategic decisions. Here are a few actionable insights:
- Track Expenses: Regularly monitor all operating expenses to accurately calculate your net income.
- Use Projections: Always include potential vacancy and maintenance expenses in your calculations to avoid overestimating ROI.
- Leverage Wisely: Consider financing options strategically to improve your ROI without excessive risk.
By applying these concepts, you can refine your approach to evaluating potential rental investments attentively.
Further, remember that real estate markets fluctuate, so keeping apprised of local economic conditions can enhance your return prospects. Understanding how to calculate and interpret your ROI allows you to align your investment strategies with your financial goals more effectively.

Analyzing Data Trends in Rental Markets
In the dynamic landscape of rental markets, understanding data trends is essential for strategic decision-making. This section dives into key statistics and trends related to rental markets, empowering you to analyze past performances and forecast future opportunities effectively.
Rental Market Dynamics
The U.S. rental market exhibits significant variability across states and metropolitan areas. Here are some noteworthy data points to consider:
- Share of Renter Households: As of 2023, states like California and New York have the highest percentages of renter households, with California at approximately 46% and New York around 45%.
- Cost of Living Index: For 2024, states such as Hawaii and California rank high on the cost of living index, making affordability a critical factor in rental demand.
- Year-on-Year Rent Changes: Between 2018 and 2024, the average apartment rent is expected to continue rising in many parts of the U.S., with year-on-year changes exceeding 5% in several growth markets.
Comparative Data Table
| State | Share of Renter Households (%) | Cost of Living Index (2024) | Year-on-Year Rent Change (2023) |
|---|---|---|---|
| California | 46% | High | +6.5% |
| New York | 45% | High | +5.8% |
| Texas | 33% | Moderate | +3.2% |
| Florida | 40% | Moderate | +4.0% |
| Illinois | 36% | Low | +2.5% |
Real-World Examples
When analyzing rental data, some metro areas stand out as particularly enticing or challenging:
- Most Attractive Metros: A recent report indicated that cities such as Austin, TX, and Denver, CO, have emerged as highly sought-after destinations for renters due to their job growth and amenities, leading to a surge in rental applications.
- Least Attractive Metros: Conversely, regions like Cleveland, OH, show a decline in desirability, with a significant lead delta indicating negative trends in renter interest and higher vacancy rates.
Practical Implications
To maximize your rental investment, consider these actionable insights derived from current trends:
- Market Selection: Focus your investment efforts on metros with a rising percentage of renter households and positive year-on-year rent changes to enhance cash flow.
- Understand Regional Variability: The cost of living impacts rental demand; evaluate how a high cost of living correlates with rental pricing in popular states.
- Leverage Technology: Utilize market analysis tools and rental property review sites to stay updated on shifts in tenant preferences and rental prices.
Actionable Advice
Keep an eye on emerging trends by regularly reviewing reports on rental vacancies and year-on-year changes in different regions. By aligning your investment strategy with data-driven insights, you can enhance your property portfolio’s performance in today’s competitive rental market landscape.
Real-World Case Studies of Rental ROI
Exploring real-world case studies of rental ROI can significantly enhance your investment strategy. By analyzing successful examples, you can better understand how to evaluate properties and gauge their profitability. Let’s dive into some key data points and case studies that illustrate varied rental returns across different scenarios.
Key Insights from Case Studies
1. Comparative ROI Analysis: One property in Atlanta yielded a gross yield of 10% but, when accounting for expenses, the adjusted ROI dropped to 6%. This reveals how vital it is to look beyond gross figures and consider net income for a comprehensive assessment.
2. Future Gains Estimation: A case study in Dallas showed that a property initially purchased for $250,000 appreciated by 20% over five years. With annual rental income of $30,000, the calculated ROI considering appreciation and net income was about 11%. This case illustrates the importance of factoring in both rental income and property appreciation when calculating ROI.
3. Risk Management Perspective: An investor in Chicago acquired a multi-family unit for $700,000. With annual expenses totaling $50,000 and gross rental income at $100,000, the net income stood at $50,000, leading to an ROI of approximately 7.1%. Understanding this ROI allowed the investor to manage risks by weighing this property’s performance against alternative investments.
4. Profitability Insights: In a residential property in Phoenix, the owner received a rental income of $2,500 per month after a $350,000 purchase. After expenses, the annual net income resulted in an ROI of about 8.6%. Tracking these figures gave the investor clarity on whether the property met their profit goals.
| Location | Purchase Price | Annual Rental Income | Annual Expenses | Net Income | ROI |
|---|---|---|---|---|---|
| Atlanta | $300,000 | $36,000 | $18,000 | $18,000 | 6% |
| Dallas | $250,000 | $30,000 | $10,000 | $20,000 | 8% |
| Chicago | $700,000 | $100,000 | $50,000 | $50,000 | 7.1% |
| Phoenix | $350,000 | $30,000 | $6,000 | $24,000 | 8.6% |
Real-World Examples
- Atlanta Case: An investor purchased an apartment building generating a gross yield of 10%. After deducing costs, the ROI reflected that while income seemed high, actual profitability revealed areas for cost management improvement.
- Dallas Venture: By combining long-term appreciation with steady rental income, this investor demonstrated how multifaceted rental properties can effectively build wealth.
- Chicago Investment: The investor’s strategic choice of a multi-family unit not only diversified income streams but also offered a significant buffer against the usual market volatility, thanks to a solid ROI.
Practical Implications for Investors
When you evaluate rental properties, always consider both gross yield and net income in your ROI calculations. Taking expenses into account will provide a clearer picture of potential profitability. Leveraging these case studies can help you:
- Identify properties that align with your financial goals.
- Compare performance across multiple investments, optimizing your portfolio.
- Manage risks effectively by understanding the broader market and individual property performance.
Understanding these real-world applications of rental ROI can empower you to make informed decisions and refine your investment strategies for maximum yield potential.
Determining Ongoing Costs and Expenses
When investing in rental properties, understanding ongoing costs and expenses is essential for estimating your true ROI. These costs can significantly impact your profitability, so it’s vital to identify and calculate them accurately.
Key Ongoing Costs and Expenses
As you venture into property investment, consider the following ongoing expenses that could affect your net income:
- Property Management Fees: If you hire a property management company, expect fees ranging from 7% to 10% of the monthly rental income.
- Maintenance and Repairs: Budget approximately 1% of the property value annually for maintenance. For example, a $300,000 property would typically incur about $3,000 yearly in maintenance.
- Property Taxes: Property taxes vary widely by location. Research indicates average property taxes can account for around 1.1% of the home’s assessed value each year.
- Insurance Premiums: Insurance is another recurring cost, averaging 0.5% to 1% of the property value annually. For a $250,000 property, that could mean between $1,250 and $2,500 each year.
- Utilities: If you cover any utilities, factor that into your expenses. A typical monthly utility expense could range from $100 to $200 depending on the property size and location.
Comparative Table of Ongoing Costs
| Expense Type | Percentage of Income/Value | Estimated Annual Cost (for $300,000 property) |
|---|---|---|
| Property Management | 7% - 10% | $2,520 - $3,600 |
| Maintenance | 1% | $3,000 |
| Property Taxes | 1.1% | $3,300 |
| Insurance | 0.5% - 1% | $1,500 - $3,000 |
| Utilities | Fixed (Monthly) | $1,200 - $2,400 |
Real-World Examples
Consider a landlord in Texas who owns a property valued at $300,000. They opted to have a property management company handle leasing and tenant relations, costing them $3,000 per year. Additionally, they allocate $2,000 annually for maintenance and repairs, $3,300 on taxes, and $1,800 for insurance. Their utility payments amount to around $1,800 yearly when utilities are included in the rent.
On the other hand, an investor in California with a similar property might face much higher expenses. Their property management fees at 10% of rental income could total $4,200 per year. Adding maintenance costs of $3,500, taxes of $3,600, and insurance fees of $2,500, their transition into rental management could incur total annual ongoing costs of approximately $14,800.
Practical Implications
Understanding these ongoing expenses can help you calculate your net income, which directly affects ROI. By budgeting accurately, you’ll be better prepared to adjust rental pricing accordingly or control costs effectively. Always keep a contingency fund for unexpected repairs or market fluctuations that may impact expenses.
Specific Facts and Actionable Advice
- Track your ongoing expenses meticulously using a spreadsheet to visualize income versus costs.
- Review your ongoing costs each year; adjusting for increases in property management fees or local tax rates can help prevent budget shortfalls.
- Be proactive with maintenance. Regular upkeep might seem costly upfront but can save you money in the long run by preventing larger repairs.
Evaluating Financial Benefits of Investment Property
When diving into the world of investment properties, understanding the financial benefits is crucial. It allows you to make informed decisions that can significantly impact your long-term profitability. By exploring various financial metrics and potential revenue streams, you can evaluate how well an investment property aligns with your financial goals.
Assessing Cash Flow
Cash flow is one of the most critical components of evaluating the financial benefits of an investment property. It’s essential to calculate the income generated after all expenses. A positive cash flow indicates that you’re making money after accounting for operating costs, making the property a potentially lucrative investment.
- Rental Income: The primary source of cash flow comes from monthly rental income. For example, if your rental property generates $2,500 monthly, that amounts to $30,000 annually.
- Operating Expenses: Typical expenses include property management fees, maintenance, insurance, and property taxes. If these total $10,000 annually, your net cash flow would be approximately $20,000.
Evaluating Appreciation Potential
Appreciation can substantially increase the financial benefits of an investment property. Over time, the value of your property may rise due to improvements, market demand, or overall economic growth.
- For instance, properties in high-demand areas have shown appreciation rates around 5% to 7% annually. If you purchase a property for $300,000, it could be worth $315,000 to $321,000 in just one year.
- Understanding neighborhood dynamics, like upcoming infrastructure projects or demographic shifts, will help you predict potential appreciation better.
Comparative Metrics Table
| Metric | Description | Calculation Example |
|---|---|---|
| Cash Flow | Income after expenses | $30,000 (Income) - $10,000 (Expenses) = $20,000 |
| Appreciation Rate | Increase in property value | $300,000 * 5% = $15,000 |
| Total Return | Total financial benefits year-on-year | ($20,000 + $15,000) = $35,000 |
Real-World Example: The Case of Urban Development
Consider a property purchased in a mid-sized city for $250,000. The area is experiencing growth due to new developments, public transport improvements, and rising local employment rates.
- The property generates $1,800 in monthly rent, totaling $21,600 annually. After expenses of $7,500, the net cash flow is $14,100.
- Additionally, the local market has seen property values increase by 6% over the past year, suggesting that this property could be worth $265,000 shortly.
Practical Implications for Investors
To maximize the financial benefits of your investment property, consider the following actionable strategies:
- Research Neighborhood Trends: Always stay updated on local economic indicators and development projects to make informed purchasing decisions.
- Diversify Income Streams: Explore options like renting to multiple tenants, offering short-term rentals, or enabling commercial leases to diversify cash flow.
- Regularly Reassess Value: Arrange annual appraisals to monitor property appreciation and adjust your investment strategies accordingly.
Investing in real estate offers unique financial benefits, particularly when done with thorough evaluation. Understanding cash flow, appreciating values, and leveraging market dynamics can significantly enhance your investment journey.
Impact of Location on Rental Returns
When it comes to rental property investments, the phrase “location, location, location” rings truer than ever. The geographical area you choose for your investment can significantly influence your rental returns. Factors such as local demand, economic conditions, and even neighborhood amenities play a crucial role in shaping your property’s profitability.
Key Factors Influencing Rental Returns by Location
1. Local Demand vs. Supply
- In areas with high demand and low supply, you can often command higher rents. For instance, markets with a significant influx of tech jobs, like Austin, TX, have shown rental increases of up to 15% annually due to robust job creation.
2. Economic Indicators
- Areas with strong economic growth typically offer better rental returns. For example, cities in the Midwest, which historically had lower rental rates, are seeing a resurgence as industries shift and jobs are created, leading to increases in rental prices by as much as 10-12% over the last two years.
3. Proximity to Amenities
- Rental properties that are near amenities such as public transport, schools, and shopping districts tend to attract tenants faster. Properties within a quarter-mile of public transport, for example, can see rental premiums as high as 20%.
4. Neighborhood Safety and Appeal
- Safety and the overall aesthetic of a neighborhood can impact vacancy rates and rental rates significantly. Homes in safe, well-maintained neighborhoods typically yield higher rental returns. According to recent studies, properties in highly rated school districts report rental rates that are, on average, 8% higher than those in areas with lower-rated schools.
Comparative Rental Returns by City and Location
| City | Average Rent Increase (%) | Key Demand Factors |
|---|---|---|
| Austin, TX | 15% | High job creation in tech sector |
| Chicago, IL | 10% | Economic stability, increasing job market |
| Miami, FL | 12% | High tourism, favorable climate |
| Seattle, WA | 10% | Growth in tech and aerospace industries |
Real-World Examples of Location Impacting Rental Returns
- Austin, TX: With big tech companies expanding, this city has become a rental hotspot, demonstrating a staggering 15% increase in average rents over the past year. Investors holding properties here have seen their ROI soar due to the influx of young professionals.
- Chicago, IL: The city’s push towards economic resilience has resulted in a 10% rental rate increase. Areas near the Loop and cultural landmarks have become particularly lucrative, making these neighborhoods prime for rental investments.
Practical Implications for Investors
Understanding how location impacts rental returns allows you to make informed decisions. Keep these points in mind:
- Research Local Market Trends: Evaluate the current trends in your target market, focusing on job growth, population numbers, and rental demand dynamics.
- Evaluate Proximity to Amenities: Look for properties that offer easy access to desirable amenities. These properties can have lower vacancy rates and higher rental yields.
- Consider Neighborhood Profiles: Invest in neighborhoods with a strong safety record and appealing aesthetics, as they tend to yield higher rental returns.
Stay current with local changes in demographics, employment opportunities, and economic shifts, as these factors will directly affect your potential rental income. Analyze areas where the economic forecast appears stable or growing, as these locations may provide better long-term returns on your investment.
Calculating ROI for Short-Term Rentals
When diving into short-term rental investments, calculating your Return on Investment (ROI) can set you on the path to success. It’s not just about what you earn; it involves weighing your costs against your income for a clear picture of profitability.
Key Metrics to Consider
To effectively calculate ROI for short-term rentals, focus on these key metrics:
1. Gross Rental Income: This includes all income earned from bookings before any expenses are deducted.
2. Net Income: This is your gross income minus operational costs such as cleaning fees, utilities, maintenance, and management services.
3. Total Investment: This encompasses your purchase price, renovation costs, furnishing expenses, and any fees associated with acquiring the property.
Example ROI Calculation
Let’s say you manage a short-term rental property where:
- Gross Rental Income: $30,000 annually
- Operational Expenses: $15,000
- Total Investment: $300,000
First, calculate your net income:
- Net Income = Gross Rental Income - Operational Expenses
- Net Income = $30,000 - $15,000 = $15,000
Now, apply the ROI formula:
ROI = (Net Annual Income / Total Investment) x 100
ROI = ($15,000 / $300,000) x 100 = 5%
Comparative Table of Short-Term Rental ROI
| Property Type | Gross Rental Income | Operational Expenses | Net Income | Investment Cost | ROI |
|---|---|---|---|---|---|
| Urban Apartment | $35,000 | $18,000 | $17,000 | $400,000 | 4.25% |
| Beach House | $50,000 | $20,000 | $30,000 | $500,000 | 6% |
| Mountain Cabin | $40,000 | $22,000 | $18,000 | $350,000 | 5.14% |
Real-World Examples
Consider two short-term rentals:
- Urban Apartment: This property generates a gross rental income of $35,000 with operational expenses of $18,000. The total investment stands at $400,000, yielding an ROI of 4.25%.
- Beach House: This more lucrative property earns $50,000 in gross income but incurs $20,000 in expenses. With a total investment of $500,000, this results in a 6% ROI, making it a more attractive investment option compared to the urban apartment.
Practical Implications
Understanding how to calculate ROI can guide your investment choices. Here are some practical steps:
- Track All Expenses: From utilities to repairs, documentation will ensure you accurately assess profitability.
- Adjust Pricing Dynamically: Monitor your market regularly to optimize pricing for high occupancy rates, increasing gross rental income.
- Consider Professional Management: Investing in a property management service can sometimes yield higher ROI by enhancing guest experiences and reducing vacancy rates.
Actionable Advice
Always assess the seasonality of your potential rental market. Many areas see fluctuating demand throughout the year, affecting your occupancy rates and, consequently, your income. Also, consider factoring in potential increases in property value when evaluating your long-term ROI; renovations and upgrades can lead to higher rental rates and thus improve overall profitability.