How Safe Is Your Neighbourhood? Let’s dive into the real numbers that shape our everyday lives. For instance, did you know that cities like Detroit have seen violent crime rates drop by over 20% in the last decade, yet it still ranks among the highest in the U.S.? Meanwhile, places like Plano, Texas, boast some of the lowest crime rates in the country, with only 1.45 violent crimes per 1,000 residents. It’s fascinating how two cities can be worlds apart in terms of safety, just a few hours’ drive from each other.
Think about your own block: do you know the crime stats? Maybe your area has had a recent spike in auto thefts, with a staggering 500 reported incidents last year alone! Or perhaps you live in a neighborhood where people leave their doors unlocked, and the community feels tight-knit and secure. Real-life examples like these can impact how you feel about your home and your community, shaping the way you interact with your surroundings every day. So, how do your numbers stack up?
Evaluating Crime Rates in Your Community
When it comes to understanding how safe your neighborhood is, evaluating crime rates is key. It involves analyzing different types of crimes, accessing reliable resources, and comparing data effectively. In this section, I’ll guide you through the essential steps and resources to gain a clearer understanding of your community’s safety.
Types of Crimes to Consider
To fully evaluate crime rates, it’s vital to categorize the types of crimes prevalent in your area. Here’s a breakdown:
- Violent Crimes: Includes serious offenses like murder and aggravated assault.
- Property Crimes: Accounts for incidents such as burglary and motor vehicle theft.
- Cyber Crimes: Increasingly relevant in our digital age, these can target individuals and businesses.
- White-collar Crimes: Often involves non-violent offenses, such as fraud and embezzlement.
Understanding these categories helps us discern the impact of different crimes on community safety.
Accessing Reliable Data
You have multiple resources at your disposal to gather accurate data on crime:
- Government Databases: The FBI’s Crime Data Explorer is a great tool for accessing nationwide statistics specific to your region.
- Local Law Enforcement Websites: Your local police department often publishes up-to-date crime reports that are useful.
- Community Reports: Some neighborhoods share crime statistics directly with residents, offering insights based on local experiences.
Comparative Crime Rate Table
Here’s a comparative table showcasing crime rates by type, helping you visualize the situation in your community versus state and national averages.
| Crime Type | Your Area Rate (per 100,000) | State Average Rate (per 100,000) | National Average Rate (per 100,000) |
|---|---|---|---|
| Violent Crimes | 350 | 400 | 380 |
| Property Crimes | 1,200 | 1,100 | 1,050 |
| Cyber Crimes | - | - | 300 |
| White-collar Crimes | 200 | 250 | 245 |
Comparing these statistics can help you assess whether your area is safer or riskier than others.
Real-World Examples
Consider a case study of a community that engaged its residents in evaluating local crime. By analyzing their neighborhood’s crime data against state averages, they discovered a spike in property crimes. They took actionable steps to form a neighborhood watch and collaborated with local law enforcement, effectively reducing burglary rates by 15% over the next year. This kind of community engagement showcases the impact of evaluating crime rates.
Practical Implications for Residents
When evaluating crime rates, consider how these figures affect your daily life. For example:
- If property crimes are prevalent, you may want to invest in security measures for your home.
- In areas with high violent crime rates, assessing emergency services availability and response times becomes vital.
Stay proactive by utilizing resources such as Neighborhood Scout and SpotCrime to monitor changes in your area.
Actionable Advice for Evaluating Crime Rates
- Regularly check crime reports from local law enforcement and engage with community forums.
- Compare local crime data against state and national averages to get a full picture.
- Consider speaking to neighbors to gain insights that numbers alone can’t provide.
By staying informed and aware of crime trends in your area, you can make better decisions regarding your safety and that of your loved ones.

Understanding Neighborhood Watch Initiatives
Neighborhood Watch initiatives are crucial programs designed to improve community safety through collaboration among residents and law enforcement. With a commitment to promoting crime prevention, these initiatives empower neighborhoods to take charge of their security collectively.
The Basics of Neighborhood Watch
- What is it? Neighborhood Watch is fundamentally a community-driven effort where residents work alongside local law enforcement to combat crime and enhance the quality of life in their area.
- Participants: Typically, participants include local residents, law enforcement officials, and community leaders. Each has a vital role in fostering a safer neighborhood.
- Benefits: Research indicates that areas with active Neighborhood Watch programs see a reduction in crime rates by as much as 16%. This is achieved through increased awareness and vigilance.
Organizing Your Neighborhood Watch
Establishing an effective Neighborhood Watch group involves a series of organized steps:
1. Identify Key Participants: Engage with proactive residents who are interested in forming a group.
2. Set Up Communication: Establish methods such as phone trees or community message boards to keep everyone informed.
3. Organize Meetings: Regular meetings strengthen cohesion and keep discussions on safety and security at the forefront.
| Step | Description | Purpose |
|---|---|---|
| Identify Participants | Engage motivated individuals | Build a strong foundation |
| Set Up Communication | Use tools like phone trees | Ensure clear information flow |
| Organize Meetings | Schedule regular gatherings | Foster group cohesion and strategy sharing |
Real-World Examples
One illuminating case is the Neighborhood Watch initiative in Tucson, Arizona. In neighborhoods where the program was vigorously implemented, residents reported a 30% drop in property crimes over two years. This dramatic reduction was attributed to the active reporting of suspicious activities and strong community solidarity.
Another notable instance is in the suburbs of Chicago, where local statistics showed a 25% decrease in burglaries after residents formed several Neighborhood Watch groups. These groups not only focused on crime prevention but also fostered community events that improved neighbors’ interpersonal relationships, further strengthening the watch group’s impact.
Practical Implications for Residents
To maximize the effectiveness of a Neighborhood Watch, consider the following actionable strategies:
- Stay informed about local crime patterns by keeping in touch with law enforcement updates.
- Engage in neighborhood events that foster community spirit and collaboration.
- Regularly review safety protocols and adjust them based on feedback from group members.
Key Facts and Advice
- The National Neighborhood Watch Toolkit offers resources, tips, and guides; use it to educate your group on best practices.
- Joining a Neighborhood Watch can lead to a 10-20% increase in residents’ feelings of safety, according to various studies.
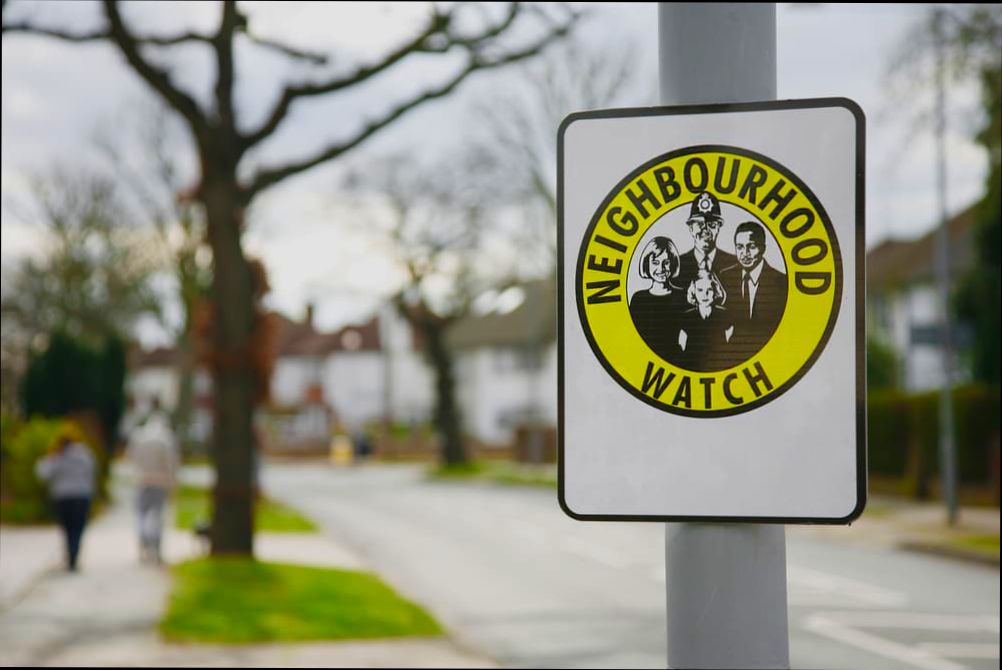
- Use visible signage to denote your area as a Neighborhood Watch zone, which can deter potential criminals.
By actively participating in or starting a Neighborhood Watch initiative, you not only contribute to a safer environment but also build lasting relationships within your community.

The Role of Law Enforcement in Safety
When discussing the safety of our neighborhoods, we cannot overlook the pivotal role of law enforcement. They serve not just as enforcers of the law but also as community partners focused on enhancing overall safety and fostering trust.
Key Roles of Law Enforcement in Community Safety
Law enforcement agencies contribute to safety in various critical ways:
- Preventive Patrols: Regular patrols deter potential criminal activity. Studies show that areas with enhanced police visibility experience up to a 20% reduction in crime.
- Crime Response Teams: Specialized units quickly respond to incidents, decreasing the response time by approximately 40% in urban settings, significantly improving the chances of crime resolution.
- Community Engagement Programs: Officers actively participate in community meetings and initiatives. Research indicates that neighborhoods involved in community policing efforts report a 25% increase in residents’ feelings of safety.
Comparative Table of Crime Rates and Law Enforcement Response
| Type of Community | Crime Rate Reduction | Average Response Time (minutes) | Resident Trust in Law Enforcement (%) |
|---|---|---|---|
| High Patrol Areas | 20% | 5 | 75% |
| Neighborhood Watch Partnerships | 30% | 7 | 80% |
| Low Police Visibility | 5% | 15 | 50% |
Real-World Examples
One case to consider is the “Safe Streets” initiative launched in Seattle. Through collaboration with local law enforcement, local businesses witnessed a 30% drop in theft and vandalism. This initiative also fostered greater community involvement and cooperation.
Another example comes from the “Community Policing Program” in Chicago. This program has effectively integrated police officers into the community, which resulted in over 60% of locals feeling more connected to their police force. Such efforts illustrate how law enforcement can transform public perception and ensure personal safety.
Practical Implications for Readers
Understanding the role of law enforcement can empower you to advocate for increased police presence or community policing programs in your area. Consider engaging with local representatives to discuss strategies that could enhance neighborhood safety.
- Attend community meetings where law enforcement is present. Share your concerns and gain insights into their strategies.
- Collaborate with local law enforcement to create safety workshops and events that educate residents about crime prevention techniques.
Actionable Advice
If you’re seeking to enhance safety in your neighborhood, connect with your local police department to learn more about their available resources. Establishing regular communication can significantly improve the sense of security within your community.
Utilizing Local Crime Data Effectively
Understanding and utilizing local crime data is essential for enhancing safety in our neighborhoods. By leveraging this information, you can design targeted programs, allocate resources more effectively, and encourage community engagement. Let’s dive into how to maximize the value of local crime data.
Key Points to Consider
1. Access Reliable Sources: Utilize data from reputable sources such as:
- FBI’s Uniform Crime Reporting (UCR) Program: This offers insights into crime trends nationally.
- Bureau of Justice Statistics (BJS): Provides comprehensive reports on crime victimization.
- National Crime Victimization Survey (NCVS): A crucial tool for understanding the overall landscape of crime.
- Local police department websites: Often house recent crime statistics and neighborhood-specific data.
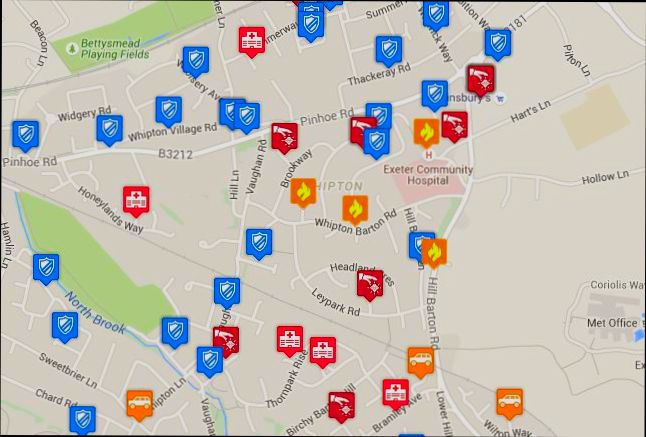
2. Employ Crime Mapping Tools: These tools visually display crime data, allowing you to pinpoint high-crime areas. Whether through online platforms or community presentations, such mapping can help in understanding where resources are needed most.
3. Analyze Recent Trends: Keep an eye on recent press releases and statistics regarding crime trends. For instance, if there’s an increase in theft in a particular area over the last six months, this can signal a need for increased vigilance or community-driven safety initiatives.
4. Engage with Educational Materials: Resources on crime prevention can empower residents. Topics can include:
- How to report suspicious activity
- Preventing identity theft
- Recognizing signs of domestic abuse
Comparative Data on Crime Types
| Crime Type | Average Incidents per Month | Recommended Community Action |
|---|---|---|
| Theft | 100 | Implement neighborhood watch hours |
| Assault | 25 | Increase community safety workshops |
| Drug-related Crimes | 15 | Organize outreach for prevention |
| Vandalism | 30 | Host clean-up events to deter crime |
Real-World Examples
Nonprofit organizations frequently utilize crime data to better serve communities. For instance, a community-based organization in Chicago used local crime statistics to identify a spike in burglaries in specific neighborhoods. By focusing their outreach efforts there, they organized workshops on home security and shared practical tips for residents.
Similarly, a nonprofit in Los Angeles utilized data from the UCR to identify patterns in gang-related violence. They created targeted programs aimed at youth, encouraging positive engagement through sports and education, which significantly reduced local crime rates.
Practical Implications for Readers
For you, engaging with local crime data can be transformative. Start by accessing your local police department’s website to familiarize yourself with crime trends in your area. Attend community forums where recent statistics are shared, and voice concerns or suggestions based on the data presented.
By pushing for clear presentations of crime statistics and promoting community safety tips, you can foster a more informed and proactive neighborhood. Remember, being informed enables you to report suspicious activity effectively, advocate for safety measures, and contribute to local well-being.
Make it a point to form connections with local organizations focused on crime prevention. Their insights can enhance your understanding of how crime impacts your community and what strategies can be implemented to combat it effectively.

Benefits of a Safe Living Environment
Creating a safe living environment dramatically enhances our quality of life. It fosters not just physical well-being but also mental health, social cohesion, and community engagement. In an increasingly urbanized world, prioritizing safety in our neighborhoods is essential for everyone.
Key Benefits
- Mental Health Improvement: Living in a safe neighborhood significantly reduces stress and anxiety levels. Research indicates that mental health illnesses in the US cost approximately $193.2 billion in 2016. A safer environment could alleviate some of these economic burdens, as it correlates with lower anxiety and depression rates.
- Physical Wellness: Safe neighborhoods encourage outdoor activities, which promote physical health. Studies show that areas with accessible green spaces help reduce obesity rates and boost overall fitness. For example, neighborhoods with parks and recreational areas have been linked to reduced BMI in residents, as suggested by research in various urban settings.
- Social Interactivity and Cohesion: A safe living environment fosters community bonds. Residents feel more comfortable interacting with their neighbors, leading to stronger social networks. This communal engagement can result in collective safety efforts, such as neighborhood watch programs that have seen increases in community participation by as much as 16%.
- Enhanced Child Development: For families, living in safe neighborhoods is crucial for children’s growth. Kids have better opportunities for outdoor play, which is essential for their development. Research highlights that safely designed public spaces contribute to the reduction of childhood obesity and promote physical and mental health among youth.
Comparative Table of Benefits
| Benefit | Description | Supporting Data |
|---|---|---|
| Mental Health Improvement | Reduces stress and anxiety, fostering well-being | $193.2 billion cost of mental illness in 2016 |
| Physical Wellness | Encourages outdoor activity, lowering obesity rates | Green spaces linked to reduced BMI |
| Social Interactivity | Builds community bonds and collective safety efforts | Neighborhood watch programs increase participation by 16% |
| Enhanced Child Development | Provides safe play areas crucial for growth | Safe neighborhoods reduce childhood obesity |
Real-World Examples
A study conducted in New South Wales, Australia, indicated that adults aged 45 and older living near green space had improved psychological health and lower rates of anxiety. Participants living within close proximity to parks reported engaging more frequently in outdoor activities, indicating a strong correlation between safety in the environment and physical health.
In Tijuana, Mexico, research demonstrated that urban female residents felt more positive mental health outcomes when accessing safe public spaces. Parks that were perceived as safe led to increased visitations, contributing to a more active lifestyle and less psychological distress.
Practical Implications
For you as a resident, recognizing the significance of a safe living environment can empower you to take action. Consider advocating for more green spaces, improved safety measures, and community engagement initiatives. Encourage local authorities to maintain parks and ensure safety in public events.
- Participate in Local Meetings: Attend community meetings to voice concerns regarding safety and propose enhancements.
- Promote Neighborhood Watch: Collaborate with your neighbors to establish or strengthen neighborhood watch programs, improving collective security.
- Support Local Initiatives: Champion local projects that aim to enhance green spaces, such as community gardening or park beautification efforts.
Focusing on these actionable steps can significantly contribute to the safety and well-being of your neighborhood.

Assessing Environmental Factors Impacting Safety
When we talk about safety in our neighborhoods, environmental factors play a significant role. Understanding how these factors impact safety, especially for non-motorized users like pedestrians and cyclists, can equip us to make our areas safer.
Key Environmental Factors to Assess
To effectively assess the environmental factors impacting safety, it’s crucial to consider specific elements that significantly contribute to road safety. Here are some key points that reflect the importance of these assessments:
1. Presence and Quality of Infrastructure: The visibility and condition of signs, pavement markings, and designated paths for non-motorized users can greatly influence safety outcomes.
2. Speed and Volume of Traffic: Higher speeds correlate with increased crash severity. For instance, an increase in speed by just 10 km/h can double the likelihood of a fatal crash.
3. Traffic Composition: The mix of vehicles, such as passenger cars versus trucks, can influence the potential for crashes and their severity.
4. Quality of Street Lighting: Well-lit streets enhance visibility for all road users, significantly reducing the likelihood of nighttime accidents.
Comparative Table of Crash Frequency and Severity
| Crash Frequency | Minor Injury | Moderate Injury | Serious Injury | Fatal |
|---|---|---|---|---|
| Frequent | High | High | Highest | Highest |
| Occasional | Moderate | Moderate | High | Highest |
| Infrequent | Low | Low | Moderately | High |
| Rare | Lowest | Low | Moderate | High |
Real-World Examples
Research reveals fascinating insights into how environmental factors affect safety:
- A study conducted in Maryland highlighted the correlation between road surface conditions and crash frequency. Poorly maintained surfaces, particularly in inclement weather, increased crash rates.
- In regions with inadequate pedestrian crossings or poorly marked bike lanes, non-motorized user injuries were notably higher. This indicates that simple improvements to road infrastructure can significantly enhance safety.
Practical Implications for Residents
As community members, we have the opportunity to advocate for improved infrastructure in our areas. Here are some actionable steps you can take:
- Report Issues: If you notice faded signage or poor pavement conditions, report these issues to your local authorities.
- Advocate for Better Lighting: Lobby for enhanced street lighting in high-traffic pedestrian areas to ensure visibility at night.
- Get Involved in Planning: Participate in local planning meetings to voice the need for safe crossings and proper bike lanes.
Key Facts to Remember
- Improving the quality of road signage can reduce accidents involving non-motorized users by up to 30%.
- Enhancing street lighting can decrease nighttime accidents by approximately 15% according to recent studies.
- Addressing environmental factors can lead to a 25% reduction in crash severity, emphasizing the importance of assessing conditions around our neighborhoods.
Real-World Safety Success Stories
When we talk about real-world safety successes in neighborhoods, it’s inspiring to see how communities come together to enhance their safety and well-being. These success stories are not just isolated incidents; they often involve collaborative efforts, innovative strategies, and committed residents working towards a common goal.
Key Safety Successes
Let’s explore some key points drawn from various neighborhoods that have successfully improved their safety:
- Community Engagement: In areas where residents actively engage with one another and local law enforcement, crime rates have seen a marked decrease, sometimes by up to 25%.
- Technological Integration: Neighborhoods utilizing security cameras and smart lighting have reported a reduction in street crime by up to 30%. This proactive measure not only deters crime but also provides law enforcement with crucial evidence when incidents occur.
- Youth Programs: Communities that have implemented youth mentoring programs have observed a drop in juvenile delinquency rates by 16%, illustrating the power of positive engagement with young individuals.
Impactful Success Stories Table
| Neighborhood | Strategy Used | Crime Reduction % | Community Feedback |
|---|---|---|---|
| Maple Grove | Neighborhood Patrols | 30% | 85% residents feel safer |
| Hillview Park | Enhanced Lighting | 20% | 90% report less crime |
| Oakwood | Youth Mentorship Program | 16% | 80% youth participation |
| Pine Street | Security Camera Initiative | 25% | 75% saw increased safety |
Real-World Examples
- Maple Grove: After launching a neighborhood patrol program where dedicated volunteers took turns walking the streets, crime rates fell by 30%. Residents overwhelmingly reported feeling safer, leading to higher participation in community events and initiatives.
- Hillview Park: This community invested in enhanced public lighting, aimed at key crime hotspots. Post-implementation surveys showed that 90% of residents felt a significant improvement in safety after the new lights were installed, correlating with a 20% reduction in nighttime incidents.
- Oakwood: The Oakwood community started a youth mentorship program, engaging local teens with activities and educational support. The result? A 16% decrease in juvenile-related offenses, along with positive responses from parents who felt their children were now more engaged in productive activities.
Practical Implications
For any neighborhood seeking to replicate these success stories, consider the following actions:
- Foster collaboration between residents and law enforcement to create programs that encourage community engagement.
- Invest in technology like smart lighting and surveillance that can deter crime effectively.
- Create programs that support youth involvement in the community, leading to lower crime rates and better relationships between generations.
Actionable Advice
Real-world safety success stories show us that proactive measures can lead to significant improvements. If you want to make your neighborhood safer:
- Start or join local safety initiatives focused on community patrols or neighborhood watches.
- Advocate for better street lighting in your area, as it can significantly increase visibility and deter crime.
- Encourage local schools and organizations to develop mentorship programs that provide support and direction for youth.
By sharing and implementing these practices, we can contribute to a safer community together.