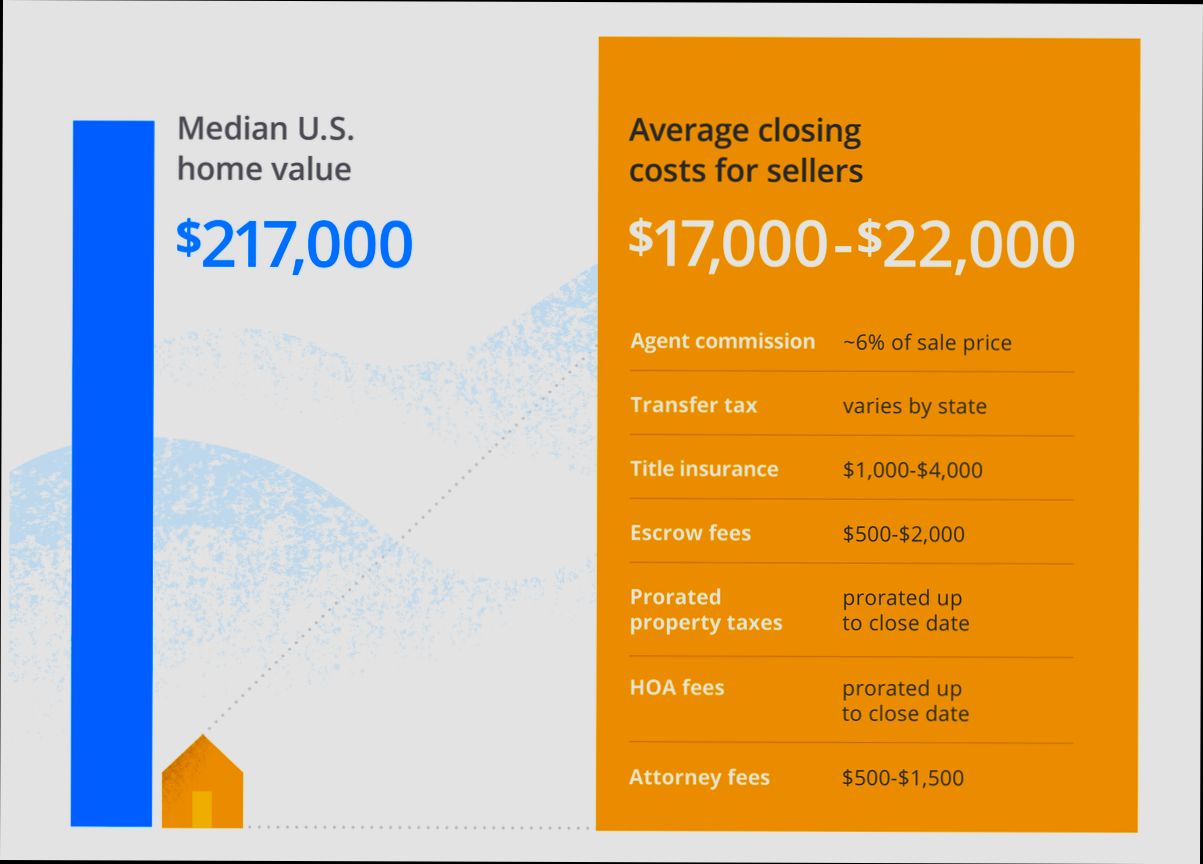
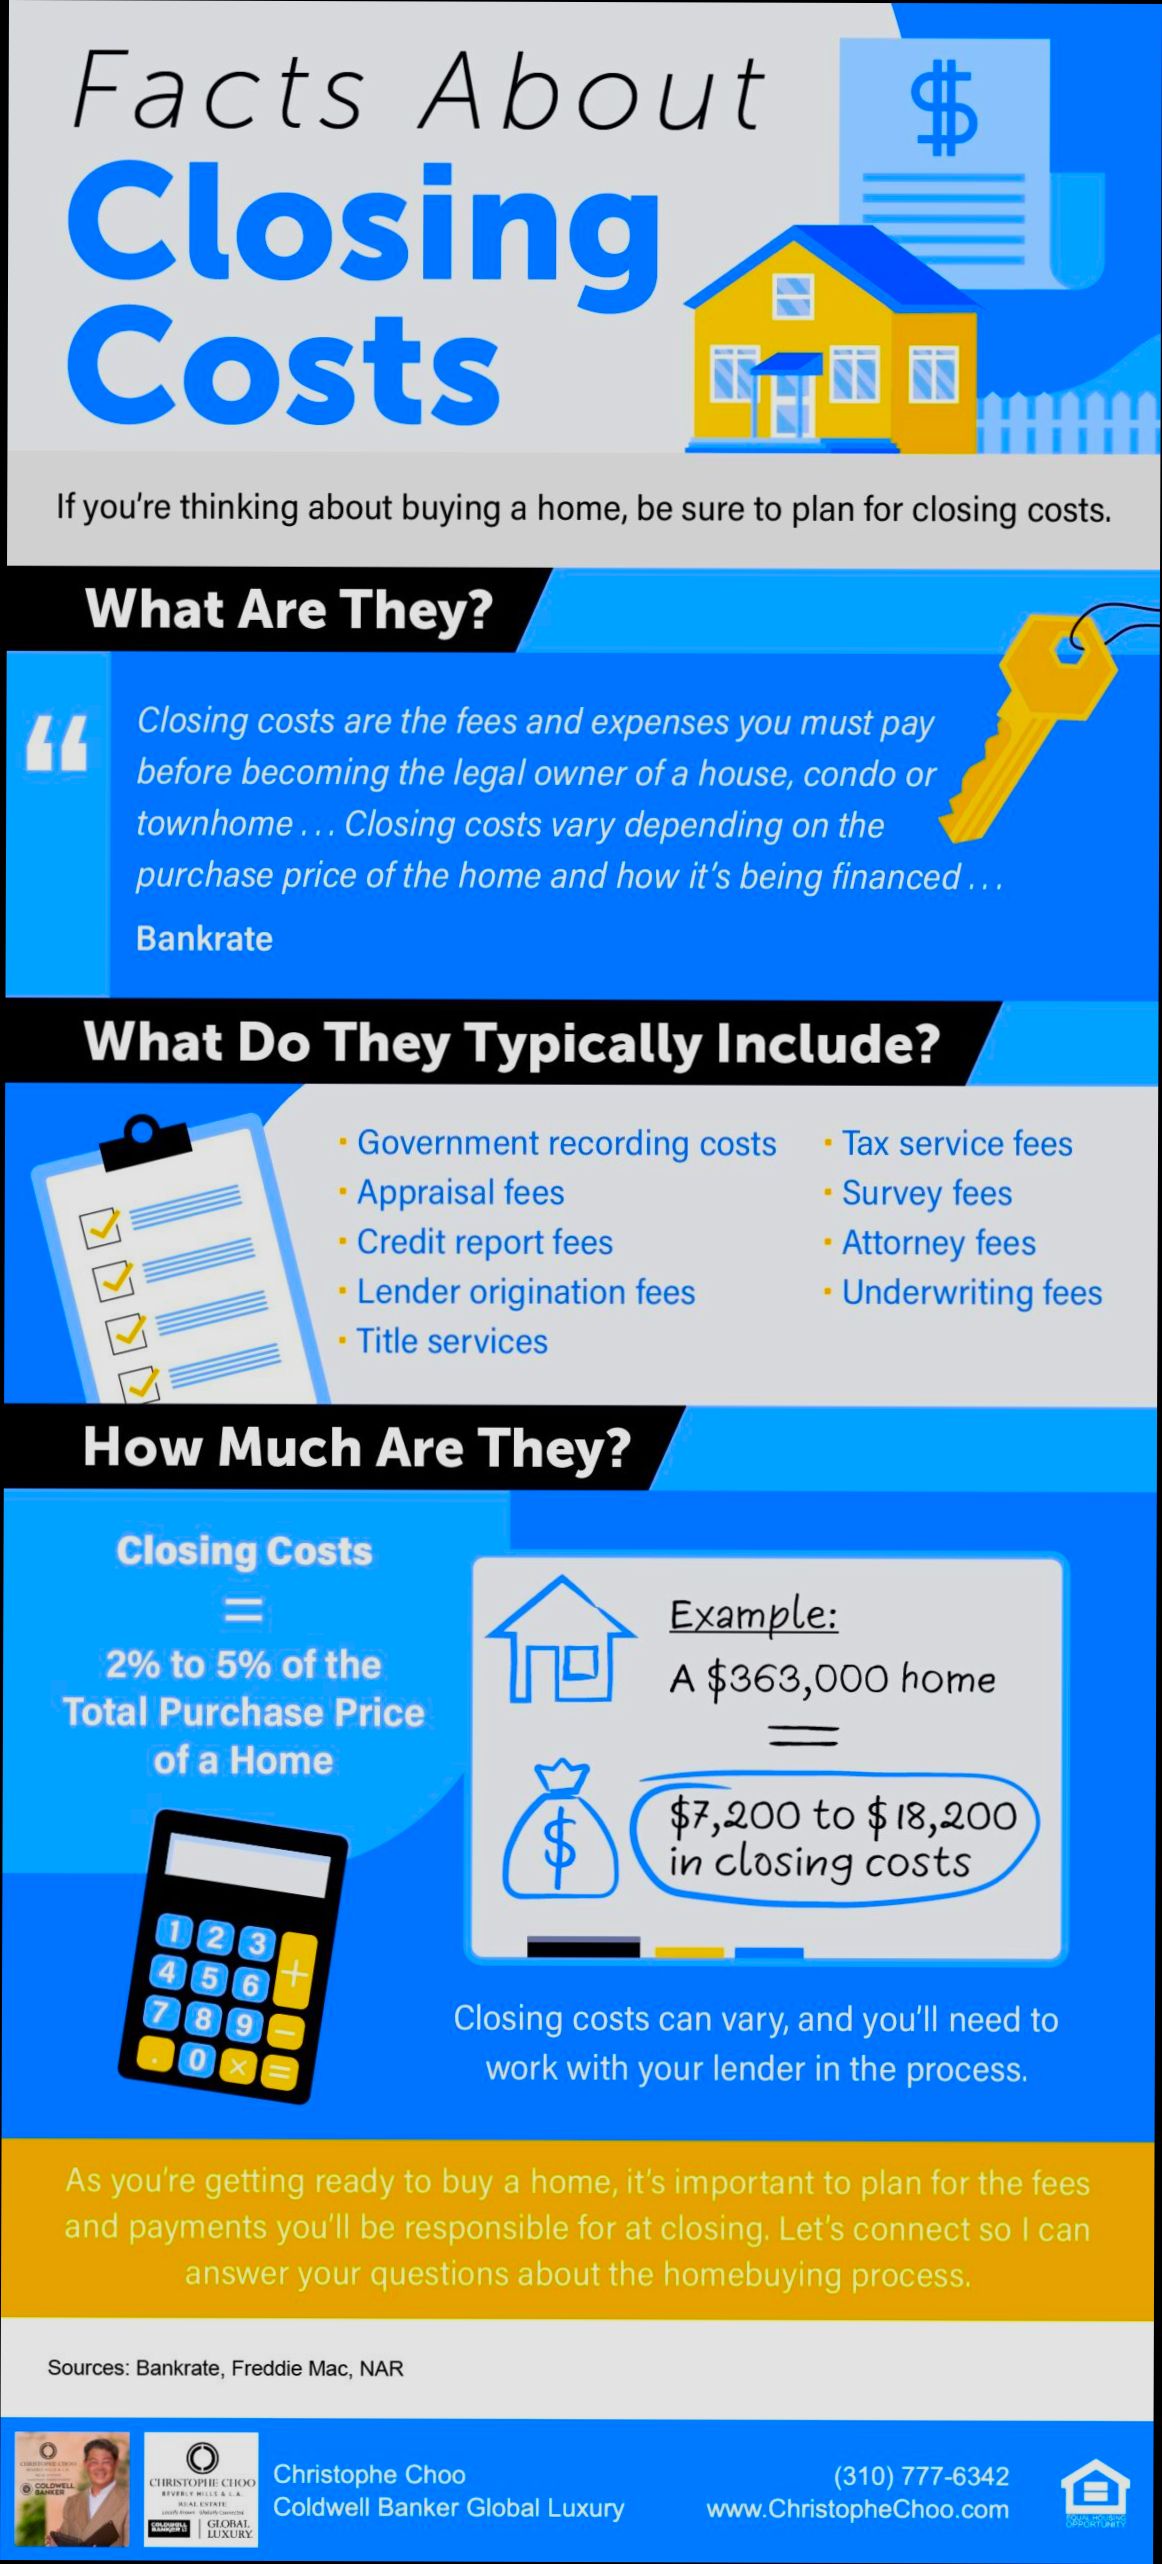
What is the Cost of Real Estate Services? Let’s break it down. If you’re buying or selling a home, you might not realize that the typical realtor commission hovers around 5% to 6% of the sale price. For a $300,000 house, that’s a hefty $15,000 to $18,000 just to get your property on the market. On top of that, many homeowners don’t factor in closing costs, which can add another 2% to 5% of the home’s price, turning a simple sale into a more expensive endeavor.
But it doesn’t stop there! If you’re a buyer, don’t forget about inspection fees, which usually run from $300 to $500. Plus, you might want to budget for appraisal costs, typically around $300 to $700. And if you’re leaning toward hiring a real estate attorney, that could set you back another $1,000 or more, depending on your state. With all these numbers floating around, it’s clear that understanding the real costs involved can be a game-changer in the buying or selling process.
Understanding Agent Commission Structures
Understanding the various commission structures real estate agents utilize can significantly impact your experience and expenses in real estate transactions. Agents typically work on commission, which can vary widely based on several factors, including location, service level, and market conditions. Let’s delve into the different structures and what they mean for you.
Key Commission Models Explained
Real estate agents generally operate under a few common commission structures:
- Traditional Commission: This model usually charges a percentage of the property’s sale price. National averages linger around 5% to 6%.
- Flat Fee: Some agents offer a flat fee for their services, which can range from $3,000 to $10,000, depending on the services included.
- Tiered Commission: Commissions may be structured in tiers, where different percentages apply to different price ranges. For instance, 4% for the first $300,000 and 3% for any amount above that.
- Discount Brokers: These brokers charge a lower percentage, typically around 1% to 3%, but often provide fewer services.
Comparative Commission Structure Table
| Commission Type | Percentage Range | Typical Services Included | Pros | Cons |
|---|---|---|---|---|
| Traditional | 5% - 6% | Full service, staging, marketing | Comprehensive support | Higher cost |
| Flat Fee | $3,000 - $10,000 | Limited to transaction handling | Predictable costs | Limited services |
| Tiered Commission | Variable by price | Full service but with tiers | Can save money on higher prices | Complexity in understanding levels |
| Discount Broker | 1% - 3% | Minimal services | Lower overall cost | Less personalized service |
Real-World Examples
In a recent case in Los Angeles, a property sold for $1,000,000. With a traditional commission of 5%, the agent earned $50,000. In contrast, a discount broker who charged a flat fee of $5,000 would result in considerable savings for the seller, albeit with fewer marketing services included.
A study showed that 45% of sellers who opted for flat fee services appreciated the transparency in costs, while about 60% of traditional commission users valued the holistic approach offered by full-service agents.
Practical Implications for You
When considering a real estate agent, assess which commission structure aligns best with your buying or selling goals. Here are some actionable steps:
- Compare Options: Always compare multiple agents and their commission structures before making a decision.
- Inquire about Services: Understand what services are included in each pricing model to avoid extra costs later.
- Negotiate: Don’t hesitate to negotiate commission rates or service levels; many agents are open to discussion.
- Read Reviews: Look at customer feedback regarding agent performance, especially under various commission models.
Actionable Advice
Before choosing an agent, always clarify the commission structure. Ask about all associated costs, including any additional fees for services not covered in the commission. If you’re considering selling a higher-priced property, inquire specifically about tiered commission possibilities to potentially save money on large transactions.
Comparative Analysis of Service Fees
When it comes to understanding the costs associated with real estate services, a comparative analysis of service fees is essential. These fees can significantly vary based on service type, market conditions, and the provider’s expertise. Let’s dive into the numbers and break down what you should know.
Key Service Fee Comparisons
- Flat Fees vs. Percentage Fees: Commission models can significantly impact your bottom line. For example, some agencies offer a flat fee for services such as listing a property, which can range between $2,500 to $5,000, regardless of the home price. In contrast, percentage-based fees typically hover around the standard commission rates we’ve discussed before.
- Transaction Fees: Beyond agent commissions, transaction fees—often charged by brokerages—can add additional layers of costs. I’ve seen these fees range from $300 to $800 per transaction, affecting the overall affordability of your real estate dealings.
- Administrative and Processing Fees: Many real estate services charge for administrative support, which can range widely. On average, these fees can cost between $200 to $600, depending on the level of service provided.
| Fee Type | Average Cost Range | Provider Type |
|---|---|---|
| Flat Listing Fee | $2,500 - $5,000 | Discount Brokerages |
| Transaction Fee | $300 - $800 | Full-Service Brokers |
| Administrative Fee | $200 - $600 | Brokerage Support |
| Marketing Fee | $500 - $3,000 | Premium Service Firms |
Real-World Examples
Let’s put these insights into perspective with some real-world examples.
- Example 1: A recent home sale in a suburb involved a traditional brokerage that charged a 5% commission on a $400,000 sale price. In addition, they levied a transaction fee of $500 and an administrative fee of $300, bringing the total service fees to roughly $25,300.
- Example 2: In contrast, another homeowner chose a discount brokerage with a flat listing fee of $3,000. They negotiated a reduced transaction fee of $250 and incurred an additional $200 administrative fee. This choice led to total service fees of about $3,450, showcasing a substantial saving compared to the traditional model.
Practical Implications for Readers
Understanding these variances in service fees not only helps you budget effectively but also empowers you to negotiate better terms. When evaluating real estate services, consider:
- Asking potential brokers about all fees upfront.
- Comparing flat fee models versus percentage-based commissions in your area.
- Reviewing the range of services included in the fees to assess their value.
If you approach these costs with informed awareness, you can better navigate your real estate transactions and save money in the process.
Positive real estate outcomes begin with understanding the nuances of service fees, so make sure to grasp the complete financial picture before making commitments!
Impact of Market Trends on Costs
Understanding how market trends influence the costs of real estate services is crucial for anyone looking to buy, sell, or manage property. Market trends can directly affect not only the prices of properties but also the various fees associated with real estate transactions. Let’s dive into how these trends can impact your costs.
Market Dynamics and Cost Fluctuations
1. Increasing Demand: When there is a high demand for properties, real estate prices tend to climb. For instance, a 15% increase in demand year-over-year can lead to a corresponding surge in service costs, as agents may charge more based on competition and reduced inventory.
2. Economic Conditions: Economic factors, including interest rates and inflation, play a significant role. Interest rates have risen by about 2% over the past year, which can elevate overall costs for buyers. This increase affects not only purchase prices but can also lead to higher fees from lenders and service providers.
3. Technological Advancements: The rise of technology in the real estate sector can lower costs for consumers. For example, platforms offering low-fee or flat-rate services have emerged, potentially reducing costs by 25% compared to traditional commission-based services, especially in markets disrupted by these new technologies.
Comparative Cost Analysis
| Market Trend | Example Impact on Costs | Percentage Change |
|---|---|---|
| High Demand | Increased property prices and fees | +15% |
| Rising Interest Rates | Higher financing costs | +2% |
| Adoption of Tech | Reduced service fees for transactions | -25% |
Real-World Examples
In a recent case study from a metropolitan area, the sharp increase in home sales—up 20%—led to an uptick in agent commissions, which rose from 5% to 6% for more competitive transactions. Conversely, in regions where tech-driven services became popular, a notable firm managed to cut traditional service fees by 30%, demonstrating that market adaptability to new technologies can reduce overall costs.
Additionally, in a coastal city where interest rates increased rapidly, buyers faced not only higher mortgage costs but also higher appraisal fees due to heightened demand, which resulted in a 10% increase over the previous year.
Practical Insights
To navigate the impact of market trends effectively, you can:
- Stay informed about local market conditions and shifts in demand that may indicate rising costs.
- Compare fees and services from different providers, especially those adapting to technological changes, to find savings.
- Factor in economic predictions from reputable sources to anticipate potential cost increases related to refinancing or purchase.
Being aware of these trends can empower you to make better financial decisions in the real estate market. By anticipating changes and adapting to them, you can manage costs strategically and optimize your real estate experience.
Real Estate Service Pricing Breakdown
Understanding the pricing breakdown for real estate services is crucial for managing your expenses throughout a property transaction. With various fees and expenses involved, having a clear picture can help you budget more effectively.
Major Pricing Components
Here’s a breakdown of common costs you might encounter while navigating real estate services:
- Brokerage Fees: Typically, brokers can charge anywhere from 1% to 3% of the sale price for their services.
- Closing Costs: These usually range from 2% to 5% of the property’s price and can include title search fees, appraisal fees, and escrow fees.
- Inspection Fees: Home inspections might cost you between $300 and $500, depending on the property size and location.
- Legal Fees: Engaging a real estate attorney can set you back about $150 to $400 per hour, depending on their expertise and your location.
Pricing Comparison Table
| Service Type | Typical Cost Range | Notes |
|---|---|---|
| Brokerage Fees | 1% - 3% of sale price | Based on negotiated terms |
| Closing Costs | 2% - 5% of sale price | Variable depending on the transaction |
| Inspection Fees | $300 - $500 | Based on property size |
| Legal Fees | $150 - $400 per hour | Varies by attorney experience |
Real-World Examples
Consider a home sale of $300,000:
- Brokerage Fees: If your broker charges 2.5%, you would pay $7,500 in fees.
- Closing Costs: Assuming a total of 4%, you would owe an additional $12,000 at closing.
- Inspection Fees: Let’s say you opt for an inspection costing $400, bringing your total upfront costs to approximately $19,900 before any further negotiations.
In another scenario, if you bought a property priced at $500,000, the potential fees would include $15,000 for brokerage fees (3%) and up to $25,000 for closing costs (5%), reflecting how significant these costs can be.
Practical Implications for You
When planning your real estate transaction, remember to account for these various cost components. Understanding the full pricing landscape helps you avoid surprises and empowers you to negotiate better. Review service agreements thoroughly to clarify any variable fees, particularly regarding inspections and legal services.
By thoroughly examining these service pricing breakdowns, you can better allocate your budget and ensure a smoother transaction. Knowing these costs ahead of time can save you considerable stress and financial strain during the buying or selling process.
Evaluating the Benefits of Professional Representation
When it comes to navigating the complexities of real estate transactions, having professional representation can make a world of difference. Not only do seasoned agents bring expertise to the table, but they also help you avoid costly pitfalls and streamline the buying or selling process.
Key Benefits of Professional Representation
1. Market Knowledge: Agents have in-depth knowledge of local market trends, helping you make informed decisions. Research indicates that properties listed with agents sell for about 20% more on average than those sold by their owners.
2. Negotiation Skills: Professionals are adept at negotiating terms that can save you money. Studies show that real estate agents typically negotiate prices that are around 8% to 10% better than those without representation.
3. Access to Resources: Agents connect you to essential resources, including home inspectors, appraisers, and mortgage lenders. Utilizing these contacts can save you both time and money in the long run.
4. Handling Paperwork: The paperwork involved in real estate transactions can be overwhelming. Agents simplify this process, reducing the risk of errors that could lead to costly delays or legal issues.
5. Peace of Mind: Having an expert on your side alleviates the stress of transactions. A survey revealed that 78% of homeowners felt more confident in their decisions when represented by a professional.
| Benefit | Details | Statistics |
|---|---|---|
| Market Knowledge | Helps in making informed decisions based on local trends. | +20% selling price |
| Negotiation Skills | Professionals can negotiate better terms and prices. | -8% to -10% price |
| Access to Resources | Connections to inspectors and lenders streamline the process. | N/A |
| Handling Paperwork | Reduces risk of errors and legal issues. | N/A |
| Peace of Mind | Alleviates stress for homeowners throughout the transaction. | 78% confidence |
Real-World Examples
Consider the case of a homeowner in a competitive market who opted to work with an experienced agent. This homeowner initially listed their property at $500,000. With the agent’s strategic pricing and negotiation skills, they sold the home for $600,000, illustrating the potential financial benefits that professional representation can yield.
Another example involves first-time buyers who felt overwhelmed by the intricacies of home purchasing. By engaging a trusted agent, they accessed invaluable resources and successfully closed on their ideal home while negotiating a price that was 5% below the market rate.
Practical Implications for You
If you’re considering buying or selling property, weigh the value of professional help against potential costs. The agent’s commission is often offset by the financial gains from their expertise and market knowledge. You can actively choose an agent with a successful track record in your specific market to maximize your benefits.
To ensure you receive the best representation, research potential agents, check their performance statistics, and seek out referrals from friends or family. Engaging a qualified professional can help you navigate the complexities of the real estate landscape and significantly impact your financial outcomes.
Remember, investing in professional representation is not just an additional cost; it’s a strategic move that can lead to greater financial success in your real estate endeavors.
Case Studies: Real-World Service Costs
In the realm of real estate, understanding service costs through concrete examples can illuminate the financial landscape for buyers, sellers, and investors alike. Let’s dive into real-world case studies that spotlight the costs linked to various real estate services, providing clarity and actionable insights.
Key Insights from Case Studies
- Big data analytics has proven transformational for companies looking to streamline their service costs. For example, leveraging rigorous data analysis, firms can optimize operational efficiencies and reduce unnecessary overheads, ultimately affecting the bottom line.
- Companies utilizing smart technology applications have reported a drop in operational costs by up to 20%. This shift is evidenced by firms that have integrated advanced data-savvy systems to better tailor their services to client needs.
- Organizations like Starbucks, through their loyalty programs, manage to gather extensive data which in turn informs their operational decisions, potentially reducing customer churn by around 15%. Lower churn rates directly correlate with reduced marketing costs and foster customer loyalty.
| Service Type | Average Cost Reduction (%) | Example Company |
|---|---|---|
| Big Data Implementation | 20% | Tech Firms |
| Customer Loyalty Programs | 15% | Starbucks |
| Fleet Management Solutions | 10% | Logistics Firms |
Real-World Examples
Starbucks’ Data Utilization
Starbucks harnesses customer data collected from millions of users to tailor their offerings, directly translating into operational efficiencies. A company of its scale reported a cost-saving attributed to optimized order fulfillment, ensuring that inventory matches demand more accurately. This insight led them to reduce excess stock while ensuring availability, lowering storage costs by 12%.
Community Management Company Efficiency
A prominent community management company in the U.S. faced increasing service complexities but opted for a high-performance finance model. By establishing a centralized data management system, they enhanced service delivery, resulting in a cost reduction on service delivery by as much as 18%. This efficient model allowed them to streamline processes that previously weighed down their operational budget.
Logistics Optimization
A logistics company utilized advanced analytics for smarter routing and driver schedule planning, leading to a 10% reduction in fuel costs. This innovative approach to managing their fleet demonstrated how data can minimize empty return trips while simultaneously decreasing traffic congestion costs.
Practical Applications for Readers
To maximize your understanding of service costs in real estate, consider these actionable insights drawn from industry case studies:
- Invest in Data Analytics: Properties and businesses can significantly lower service costs by investing in analytics tools that inform smarter operational decisions.
- Embrace Technology: Simplifying processes and adopting technology can enhance customer experience, mitigate churn, and cut down unnecessary expenditure.
- Tailor Services: Utilize customer data to refine service offerings. Tailored services can lead to higher satisfaction rates and decreased operational costs.
Focusing on real-world examples of service costs will not only help you navigate the sometimes murky waters of real estate transactions but also empower you to make informed decisions that can lead to substantial financial benefits.
Key Statistics in Real Estate Pricing
When delving into real estate pricing, understanding key statistics can empower you to make informed decisions. These figures are not just numbers; they represent trends and dynamics that can significantly impact your buying or selling experience.
Key Pricing Statistics to Know
1. Average Home Price Appreciation: In the last year, home prices have increased by approximately 10% on average across major metropolitan areas, illustrating a robust market.
2. Price per Square Foot: The national average price per square foot for homes is about $200, but this can vary dramatically based on location, with urban centers often seeing figures closer to $400.
3. Market Days on Average: Homes sold in 2023 have spent an average of 30 days on the market, indicating a competitive landscape where pricing strategies are essential.
4. Price Reductions: Approximately 25% of listings experienced a price reduction during the sale process, signaling that sellers may need to adjust their pricing based on market feedback.
5. Investment Returns: Real estate investors can expect a median return on investment of around 8% annually, illustrating the profitability potential of well-priced properties.
Comparative Pricing Overview
| Metric | Average Value | Variation Based on Region |
|---|---|---|
| Average Home Price | $300,000 | $150,000 (rural) to $600,000 (urban) |
| Price per Square Foot | $200 | $100 (small towns) to $400 (cities) |
| Days on Market | 30 days | 15 days (hot markets) to 60 days (slower sales) |
| Listings with Price Cuts | 25% | 10% (stable markets) to 40% (volatile markets) |
Real-World Examples
To illustrate these statistics, let me share this:
- In San Francisco, median home prices hit an astonishing $1.5 million, where the price per square foot can soar to $1,000. Conversely, in a less populated area like Boise, ID, similar metrics show homes at $350,000 with an average of $150 per square foot.
- A recent analysis of homes sold in Chicago showed that properties listed above $500,000 experienced a 35% chance of a price reduction, highlighting the importance of strategic pricing in high-stakes markets.
Practical Implications for Readers
Understanding these statistics allows you to set realistic expectations whether you’re buying or selling. For instance, if you’re selling in a hot market, pricing your home slightly above the average can attract buyers and lead to quicker sales. Conversely, knowing the average days on the market helps you gauge when to consider price adjustments if you’re not receiving offers.
Additionally, being aware that 10% of average home price appreciation exists can inform you of potential future investment strategies, allowing you to plan your financial goals accordingly.
Finally, remember that price per square foot can vary greatly based on your chosen area, which is essential when comparing potential purchases. Always conduct thorough research into local pricing trends to better assess value.