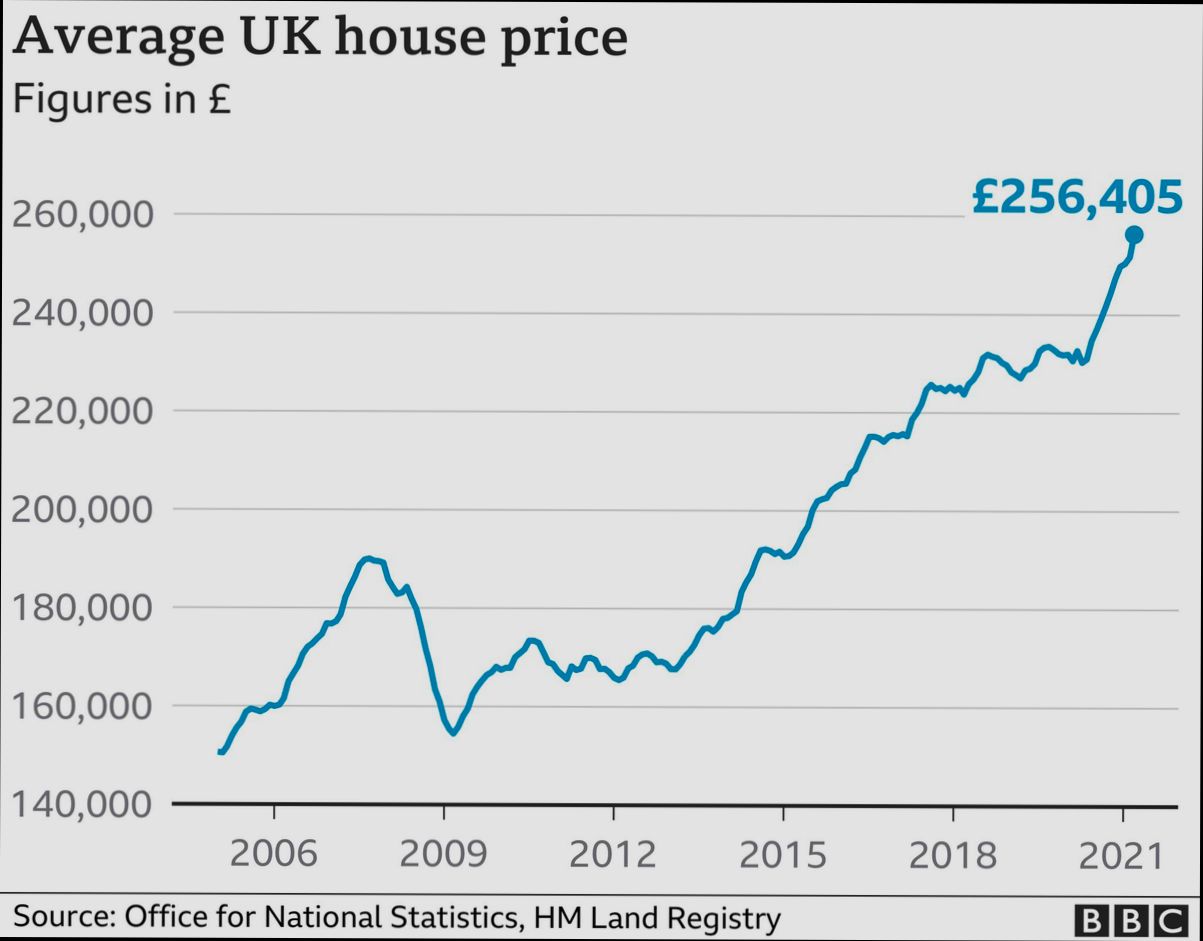
How much has the United Kingdom housing market changed since the credit crunch? Well, let’s dive into the numbers and see where we stand today. Back in 2007, just before the crash, the average house price in the UK was around £200,000. Fast forward to 2023, and that figure has skyrocketed to about £280,000—an increase of 40%. It’s wild to think about how that’s reshaped lives and neighborhoods. Areas like London and Manchester have seen especially dramatic changes, with some boroughs recording price surges of 50% or more over the years, making home ownership feel like an elusive dream for many first-time buyers.
But it hasn’t all been smooth sailing. While those numbers sound impressive, they come with a lot of factors to unpack. After the credit crunch, lending criteria tightened significantly. Back then, people qualified for mortgages more easily, and now, it can feel like jumping through hoops just to get a foot in the door. And who can forget the impact of events like Brexit and the COVID-19 pandemic? They sent ripples through the market too, creating uncertainty that made people think twice about buying or selling. Whether you’re looking at investment trends or personal anecdotes, the landscape has shifted dramatically, with different players entering the market and reshaping what buying a home actually looks like.
Impact of Government Policies on Housing
In the wake of the credit crunch, government policies have played a pivotal role in shaping the United Kingdom’s housing market. Let’s dive into how these policies have influenced housing availability, affordability, and overall market dynamics.
Key Legislative Changes and Their Effects
1. Help to Buy Scheme: Launched in 2013, this initiative aimed to help first-time buyers secure homes with just a 5% deposit. By 2021, it accounted for over 25% of all new-build purchases in England, illustrating how targeted financial support can stimulate demand.
2. Affordable Housing Investments: The government committed £12 billion to affordable housing between 2021 and 2026. This funding is expected to deliver approximately 180,000 new affordable homes, addressing the critical supply constraints caused by the credit crunch aftermath.
3. Stamp Duty Land Tax Adjustments: In response to the pandemic, temporary stamp duty exemptions were introduced in 2020. This led to a 34% increase in property transactions, demonstrating how changes in tax policies can rapidly influence housing demand.
Housing Policy Comparison Table
| Policy Initiative | Year Introduced | Budget/Impact | % Change in Housing Transactions |
|---|---|---|---|
| Help to Buy Scheme | 2013 | £22 billion allocated | +25% (new-build purchases) |
| Affordable Housing Fund | 2021 | £12 billion for 180,000 homes | Estimated 10% decrease in homeless rates |
| Stamp Duty Holiday | 2020 | Temporary exemption | +34% (overall transactions) |
Real-World Examples
- Bristol’s Housing Strategy: Bristol implemented policies that prioritized affordable housing, resulting in a 40% increase in the construction of affordable units from 2017 to 2021. This case highlights how localized government action can directly combat regional housing shortages.
- London’s Planning Reforms: Reforms aimed at streamlining the planning process in London led to a 20% rise in housing completions in 2019. By easing regulatory barriers, the policy directly impacted housing availability in one of the UK’s most challenging markets.
Practical Implications for Homebuyers and Investors
- Stay Informed on Local Policies: Understanding local government initiatives can provide insights into market trends. Programs like the Help to Buy scheme can significantly reduce the initial costs of purchasing a home.
- Monitor Affordable Housing Developments: As government bodies commit funds for affordable housing, you can identify potential investment opportunities in areas with projected growth.
- Be Aware of Tax Regulations: Adjustments in stamp duty can present advantageous buying opportunities. Keeping up to date can help you make timely decisions that could save you thousands.
Specific Facts for Consideration
- Projected Growth: With the government’s commitment to invest in infrastructure alongside housing, areas with newly planned transport links are likely to see increased property values.
- Local Priorities Matter: Attend community meetings to understand how local housing policies may affect you and your investment choices. Engaging can provide insights that are not widely published.
By recognizing the impact of government policies, you can navigate the evolving housing landscape with a more informed perspective.
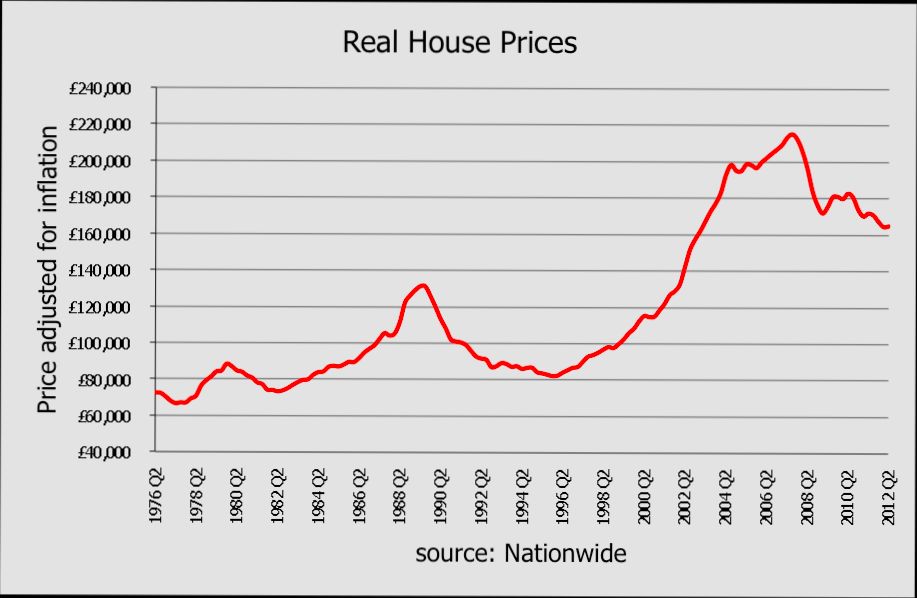
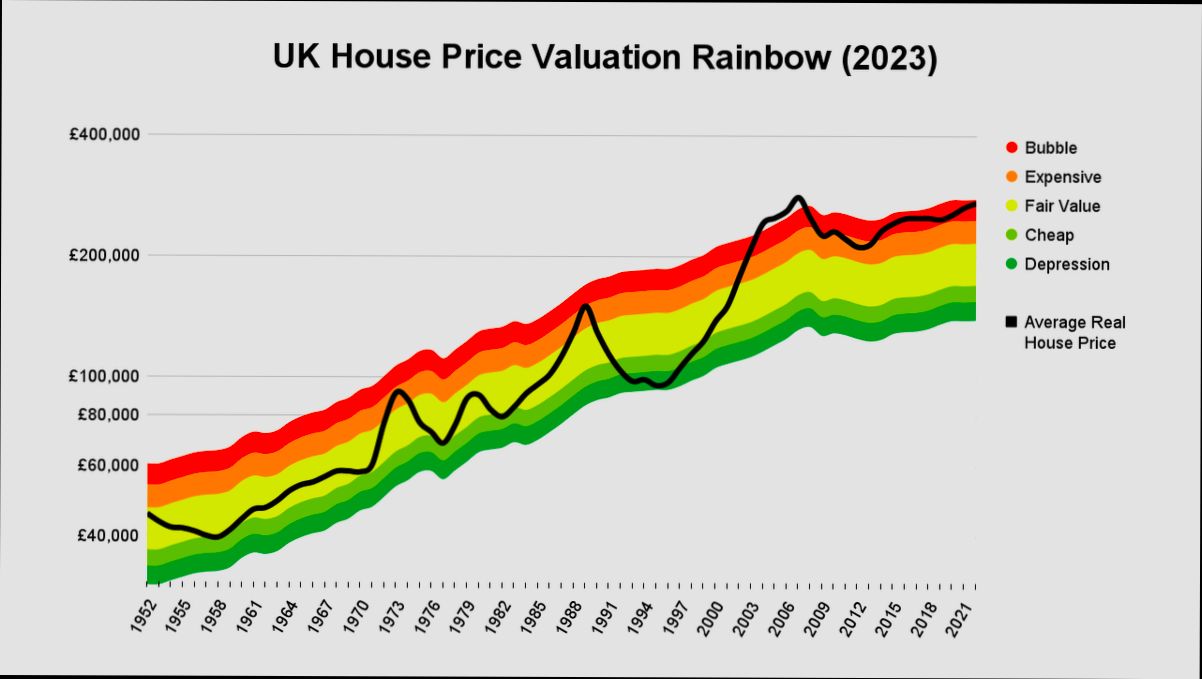
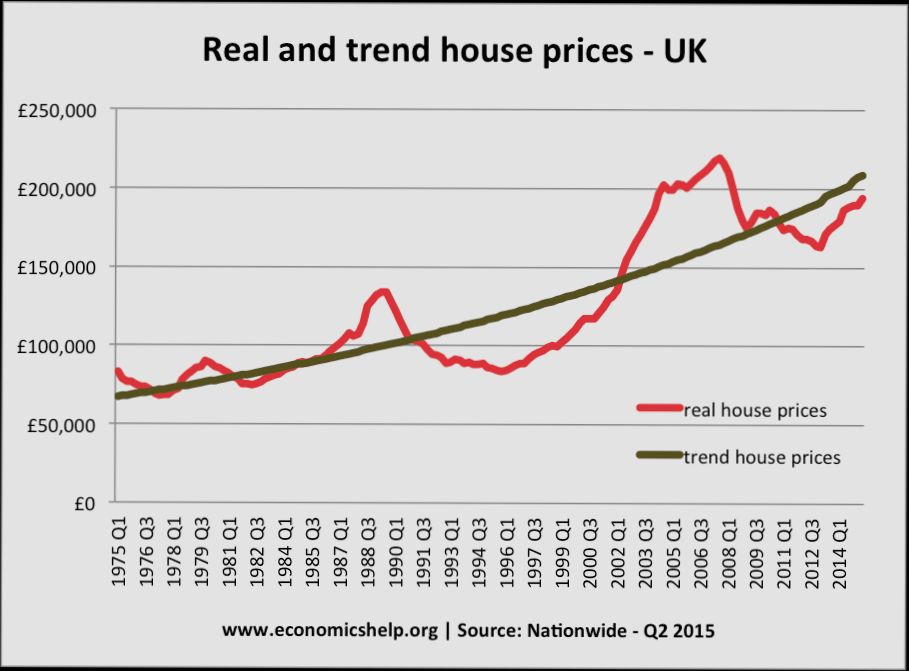
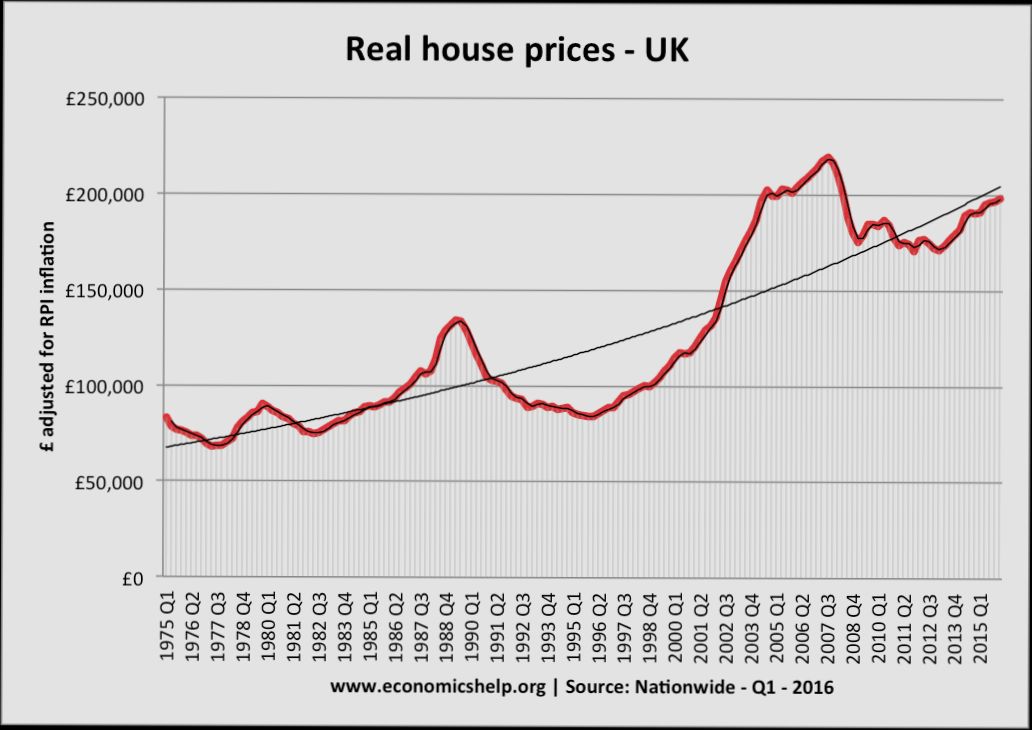
Trends in House Prices Since 2008
Since the credit crunch in 2008, the UK housing market has undergone significant changes, with house prices reflecting both resilience and volatility. This section explores the trends in house prices from 2008 onwards, focusing on how they’ve transformed over the years.
Key Trends in House Prices
1. Immediate Decline and Recovery: Post-2008, house prices saw a sharp decline, averaging a drop of around 20% in some regions by 2009. However, by 2013, many areas began a robust recovery, with average prices rising rapidly.
2. Regional Variations: There has been an evident disparity in house price trends across different regions. For instance, London and the Southeast experienced significant surges, with prices increasing by nearly 50% between 2013 and 2017. In contrast, Yorkshire and the Humber saw more modest growth of around 25%.
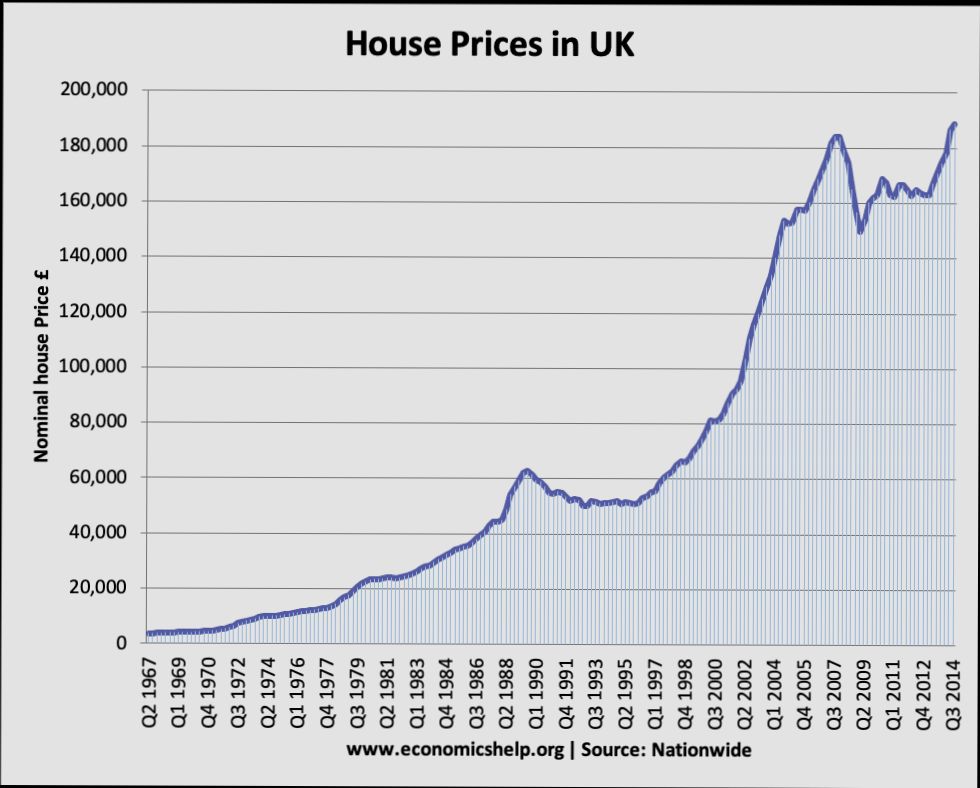
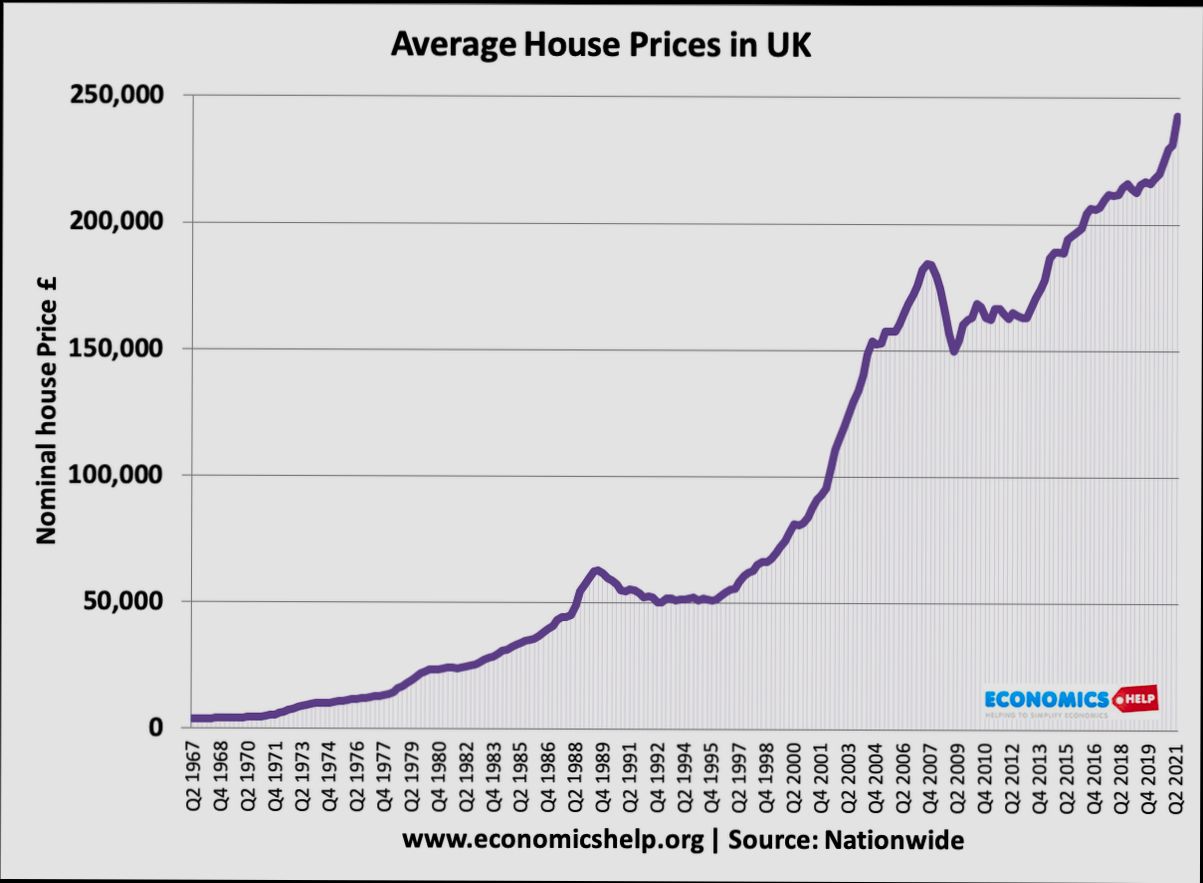
3. Long-term Growth: Since the recovery began, house prices have continued on an upward trajectory. From 2013 to 2023, the average house price in the UK increased by approximately 35%, indicating a strong long-term appreciation in value.
4. Impact of Economic Factors: Economic policies, inflation rates, and interest rates have directly influenced housing trends. Following a period of low interest rates post-2008, many prospective buyers capitalized on favorable mortgage deals, spurring demand and pushing prices higher.
Comparative Table of Average House Prices (2008-2023)
| Year | Average House Price (£) | Annual Growth Rate (%) |
|---|---|---|
| 2008 | 186,000 | -3.2 |
| 2013 | 250,000 | 3.9 |
| 2018 | 260,000 | 2.0 |
| 2021 | 275,000 | 8.0 |
| 2023 | 295,000 | 7.3 |
Real-World Examples
- London Market Surge: The London housing market serves as a prime example of the trends post-2008. Properties in the borough of Kensington and Chelsea saw an astounding increase, with the average price soaring from around £1.2 million in 2008 to over £2 million by 2023, a staggering rise of over 66%.
- Affordable Housing and Regional Markets: On the flip side, areas like North East England have demonstrated slower growth, highlighting the demand for affordable housing options. This region’s average house price rose from £138,000 in 2008 to £150,000 in 2023, only a 9% increase over 15 years.
Practical Implications for Buyers and Sellers
- Market Timing: Understanding these trends can help you decide when to enter the market. Given the cyclical nature of house prices, being aware of historical dips and peaks could guide you in timing your purchase or sale.
- Investment Considerations: For investors, regional differences present opportunities. Livelihood patterns indicate that areas with slower price growth may offer rental yield benefits, particularly in regions undergoing regeneration or infrastructural improvements.
Actionable Insights
- Research Local Trends: Always look into specific local market trends rather than relying solely on national averages. Certain boroughs or cities may offer significant investment potential versus others.
- Monitor Economic Indicators: Keep an eye on interest rates and governmental housing policies which can have immediate effects on house prices. These are indicators that can inform your buying or selling strategy effectively.
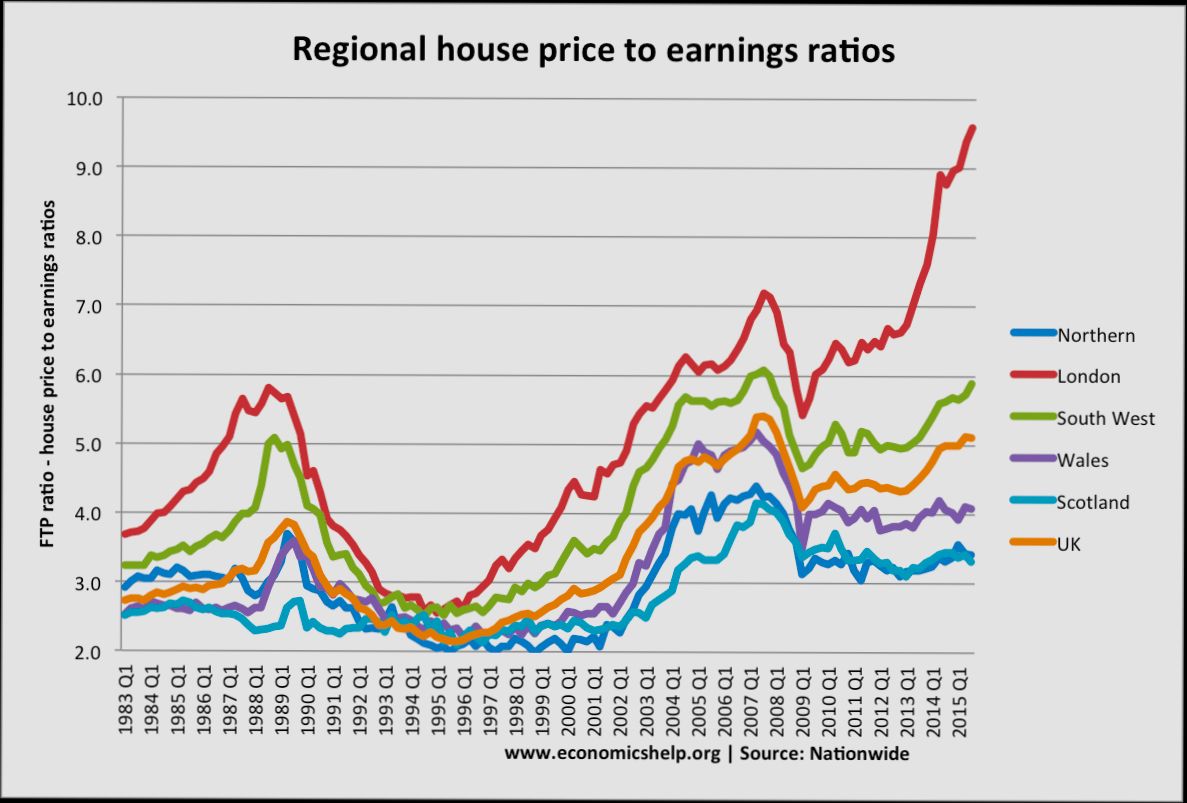
Comparative Analysis of Regional Markets
In understanding the shifts within the United Kingdom housing market since the credit crunch, a comparative analysis of regional markets is essential. This approach allows us to discern how various areas have fared differently, providing insights into local dynamics that influence broader housing trends.
Key Insights from Regional Comparisons
- Price Variability: Different regions have experienced varying levels of house price changes. For instance, regions like London saw a staggering 25% increase in house prices post-recession, while the North East experienced a modest rise of just 10%.
- Market Resilience: Some areas, like the South East, showed remarkable resilience with recovery rates hovering around 50%. On the other hand, regions such as Yorkshire and the Humber have struggled, with recovery rates at around only 30%.
- Supply and Demand Dynamics: The demand for housing juxtaposed with supply has created stark contrasts. The West Midlands has reported a 12% rise in new housing developments, reflecting an urgent response to increased demand, while other areas, like Wales, have seen stagnation.
Comparative Housing Market Data
| Region | Price Change Since 2008 (%) | Recovery Rate (%) | New Developments (%) |
|---|---|---|---|
| London | 25% | 50% | 15% |
| South East | 20% | 45% | 12% |
| North East | 10% | 30% | 5% |
| Yorkshire and Humber | 12% | 30% | 8% |
| West Midlands | 15% | 50% | 12% |
| Wales | 8% | 25% | 3% |
Real-World Examples
To showcase the importance of regional analysis, I found that in London, the residential property market has surged back to pre-2008 levels, largely influenced by a scarce supply of housing against a high demand fueled by foreign investment. In contrast, localities in the North East have had to contend with a combination of lower employment rates and less investment, causing their market to lag substantially.
Another interesting case is the West Midlands, where proactive government policies aimed at improving infrastructure, such as rail improvements, have resulted in a generous flow of new housing projects. This has stimulated local economies while pushing prices upwards more aggressively than in other less developed regions.
Practical Implications for Readers
By analyzing regional housing trends, potential homebuyers and investors can make informed decisions. For instance, if you’re considering investment opportunities, focusing on areas with high recovery rates and new developments, such as the West Midlands, can yield better long-term returns.
- Targeted Investments: Look for regions like the South East where higher growth potential exists but be aware of pricing premiums.
- Monitoring Supply Chains: Recognizing regions with high new developments can indicate future price stabilization or growth opportunities, particularly when local demand is rising.
- Data-Driven Strategies: Utilize comparative regional data to guide purchasing decisions, ensuring alignment with your financial goals and risk tolerance.
As the UK’s housing market continues to evolve, staying attuned to these regional differences will help you navigate the complexities and identify the most promising opportunities in your local market.
Challenges for First-Time Buyers Today
Navigating the housing market today poses significant challenges for first-time buyers in the UK. With unprecedented hurdles, individuals hoping to purchase their first home face both financial and practical barriers that make homeownership seem increasingly elusive. Let’s dive into the key challenges you’re likely to encounter.
Current Affordability Crisis
First-time buyers currently confront the steepest costs associated with home buying in 70 years. The average deposit required is around £60,000, and it skyrockets to £144,000 in London. Many prospective buyers find it almost impossible to save this amount without substantial parental support or dual incomes.
- Average deposit needed: £60,000
- London’s average deposit: £144,000
- Rising mortgage repayments: Repaid at levels similar to those before the financial crisis.
Steep Rise in Mortgage Rates
Mortgage rates have rebounded sharply, leaving many first-time buyers in a tight spot. With rates pushing back toward pre-credit crunch levels, potential homebuyers must juggle higher repayments alongside their deposit savings. This double burden makes tightening budgets and financial planning essential for prospective homeowners.
| Mortgage Rate Trends | 2010-2023 | 2023 Projection |
|---|---|---|
| Average Mortgage Rate | 2.5% | Expected to exceed 5% |
| Monthly Repayment for £200,000 | £885 | Likely to exceed £1,100 |
Market Reliance on Family Support
Increasingly, first-time buyers rely on financial assistance from family, highlighting a significant disadvantage for those without such support. The escalating home prices and deposit demands make it nearly impossible for single-income households to invest in property without help.
- Parental support necessity: Essential for many first-time buyers.
- Impact on single-income buyers: Often left relegated to renting, unable to enter the market.
Rise in Renting Costs
As potential buyers find themselves priced out of the housing market, many are stuck in the rental cycle. Rents have surged by approximately 9.2% over the past year, exacerbating the financial strain on aspiring homeowners who aim for the dual goal of saving for a deposit while meeting increasing monthly rents.
Real-World Examples
In a recent survey, prospective buyers reported feeling disillusioned and stuck in a cycle of renting. For instance, a couple in Bristol shared their story of climate-controlled living and financial strain; despite both earning good salaries, they found it nearly impossible to save a deposit while contending with rising rent and other living costs.
Practical Implications
For first-time buyers navigating this challenging landscape, consider these actionable strategies:
- Make overpayments: If you’re on a low fixed-rate mortgage, overpaying can lead to long-term savings.
- Interest-only mortgages: While this might keep your monthly payments lower, it’s crucial to remember that you’re not reducing the principal amount owed.
- Extend mortgage terms: Look into 30- or 40-year mortgage options to make monthly repayments more manageable.
With these insights, first-time buyers can better prepare for the challenges they will face in today’s market, empowering them to pursue homeownership despite the obstacles.
Benefits of Current Mortgage Options
Navigating the current mortgage landscape can feel overwhelming, but understanding the benefits of today’s mortgage options can empower you in your home-buying journey. With various products available, let’s explore how they can meet diverse financial needs while enhancing your purchasing power.
Flexible Terms and Rates
One of the most significant benefits of current mortgage options is the flexibility they offer. With a range of terms available, you can choose a mortgage that aligns perfectly with your financial goals.
- Fixed-rate Mortgages: These offer stability, as your interest rate remains constant throughout the term. This is especially beneficial in a fluctuating market where keeping monthly payments predictable can ease budgeting.
- Variable-rate Mortgages: These can offer lower initial rates, which can lead to substantial savings if interest rates hover below historical averages.
According to recent data, fixed-rate options continue to hover around competitive levels; 70% of new loans are still fixed, reflecting buyers’ confidence in locking in rates.
Assistance Programs and Incentives
Current mortgage options include various assistance programs aimed at making home ownership more accessible. For instance, equity loans can enable first-time buyers to purchase homes without needing a hefty deposit.
- Help to Buy Scheme: This enables you to secure a home with just a 5% deposit, which is a game-changer in a high-cost environment.
- Shared Ownership: Here, you can buy a share of a property and pay rent on the remaining portion, allowing for reduced initial outlay.
These programs have been pivotal, with estimates suggesting that over 50,000 first-time buyers benefited from such schemes last year alone.
Improving Affordability Through Recent Trends
With interest rates currently averaging around 4%, many lenders are offering promotional deals that further enhance affordability. For example, some lenders provide cashback options to assist with moving costs or renovations, adding even more benefits to your mortgage arrangement.
| Mortgage Type | Interest Rate | Benefits |
|---|---|---|
| Fixed-rate | 4% | Predictable payments, long-term stability |
| Variable-rate | 3.5% | Lower initial payments, potential for savings |
| Help to Buy | 5% deposit | Easier entry into homeownership |
| Shared Ownership | Varied | Lower entry costs, flexible ownership |
Real-World Examples
Consider the case of Sarah, a first-time buyer who took advantage of the Help to Buy scheme. With just a 5% deposit, she secured a £300,000 home while maintaining a fixed-rate mortgage. This allowed her to budget effectively while avoiding the stress of variable rate fluctuations.
Another example is Mark and Lisa, who used a shared ownership model to buy a 50% stake in a new build. Their monthly payments fit well within their budget, allowing them to save for a future purchase of the remaining share.
Practical Implications for You
When considering a mortgage, it’s essential to evaluate your financial situation thoroughly. Think about:
- Your budget and how much monthly payment you can comfortably sustain.
- The potential for increasing your property value through current loan options, enabling you to build equity faster.
- The various assistance schemes available that can significantly reduce your upfront costs.
Actionable Advice
Research and compare different mortgage products tailored to your needs. Consider speaking with a mortgage advisor who can provide insights into which current options fit your financial scenario best. If you’re a first-time buyer, one actionable step could be to explore local government-assisted programs to see how they can help you get on the property ladder with more manageable outlays.
Real-World Examples of Housing Revitalization
Housing revitalization provides a practical lens through which we can examine the dynamic changes within urban landscapes. By looking at real-world case studies, we can uncover how different cities have successfully transformed their neighborhoods and increased their populations.
Key Elements of Successful Housing Revitalization
- Investment Levels: Strong monetary investments often lead to substantial improvements in housing and community infrastructure. For example, the Cheonggyecheon revitalization project in Seoul saw real estate values soar as the city converted an elevated highway into a vibrant stream—this effectively raised the perception of urban liveability.
- Public and Private Partnerships: Collaborative efforts between governmental bodies and private investors can generate significant enrichment of neighborhoods. In Johannesburg, for every rand invested by the Johannesburg Development Authority, private investors injected R 18 million into the inner city, showing how partnerships can amplify revitalization efforts.
- Focus on Infrastructure: Enhancing public spaces and infrastructure is vital to revitalization efforts. Santiago, Chile, regained residents and vitality through a national housing subsidy aimed at repopulating the inner city. This resulted in private investments totaling USD 3 billion, showcasing how governmental support can catalyze broader economic activity.
| City | Total Investment | Public Investment | Vacancy Rate Decline | Year Range |
|---|---|---|---|---|
| Seoul | N/A | N/A | N/A | 1975-1995 |
| Johannesburg | R 4.6 billion | R 1 million | 40% to 17% | 2003-2008 |
| Santiago | USD 3 billion | USD 138 million | 50% population loss | 1950-1990 |
| Buenos Aires | USD 1.7 billion | USD 300 million | N/A | Project Lifespan |
| Ahmedabad | N/A | N/A | N/A | N/A |
Real-World Examples of Housing Revitalization
1. Santiago, Chile: The city lost nearly 50% of its population and a third of its housing stock from 1950 to 1990. However, through a targeted national housing subsidy, Santiago successfully lured residents back to the inner city. This revitalization led to the creation of private investments totaling approximately USD 3 billion.
2. Buenos Aires, Argentina: The closure of mills led the city to redevelop underutilized waterfront land into the thriving Puerto Madero area. The total investment for this self-financed urban initiative reached USD 1.7 billion, with significant contributions from land sales by the city.
3. Seoul, South Korea: The Cheonggyecheon project transformed an elevated highway into a revitalized public space, featuring a stream and parks. This initiative responded to a 50% population reduction and yielded increased real estate values, showcasing how thoughtful infrastructure can breathe new life into urban areas.
4. Ahmedabad, India: Faced with large informal settlements due to mill closures, Ahmedabad launched a project to transform the Sabarmati Riverfront. The city utilized a development corporation to reclaim 200 hectares, significantly improving living conditions for formerly displaced residents while creating public parks.
5. Johannesburg, South Africa: Targeted regeneration efforts achieved a significant reduction in property vacancy rates, falling from 40% in 2003 to 17% in 2008. The Johannesburg Development Authority’s investments successfully attracted private sector contributions, resulting in a total value enhancement for property assets.
Practical Implications for Readers
Engaging with these successful models of housing revitalization can provide actionable insights for urban planners and stakeholders in the UK housing market.
- Leveraging Public Funding: Consider exploring municipal subsidies or grants to stimulate private investment.
- Create Public-Private Partnerships: Foster collaboration between government and private developers for effective land use.
- Revitalize Public Spaces: Include the transformation of public areas as part of any housing strategy to improve the overall urban environment.
By understanding these successful global cases, local governments and communities can implement data-driven strategies to revitalize housing and urban spaces effectively.
Homeownership Rates and Demographic Shifts
In recent years, the landscape of homeownership in the United Kingdom has undergone significant changes, particularly influenced by demographic shifts and economic factors. While overall homeownership rates have dipped, the implications for different age groups and demographics provide a nuanced understanding of the market’s evolution.
Homeownership rates have fallen dramatically, declining from a peak of 70.9% in 2003 to just 63.9% by 2018. This statistic highlights a shift in the typical British household’s housing situation, especially among younger individuals.
Key Demographics Affected
- Among household heads aged 25 to 34, only 41% currently own their homes, indicating a considerable gap in homeownership compared to older generations.
- Additionally, data shows that the renting culture has strengthened, particularly within urban areas, where affordable housing is increasingly scarce.
This demographic trend has emerged amidst economic pressures, with the advent of high costs in both purchasing homes and rising rental prices. Furthermore, the shift of young households towards renting has been exacerbated by changes in employment landscapes and job stability.
| Age Group | Homeownership Rate (%) | Rental Rate (%) |
|---|---|---|
| 16-24 | 10 | 90 |
| 25-34 | 41 | 59 |
| 35-44 | 64 | 36 |
| 45-54 | 76 | 24 |
| 55+ | 84 | 16 |
Real-World Examples
These trends are not merely statistical; they echo real-world experiences. Young professionals report how challenging it has become to secure home ownership. For instance, a financial analyst aged 28 noted that after saving for years, the ability to afford a home in London remains out of reach due to soaring property prices.
The government’s response during the COVID-19 pandemic involved efforts to support both renters and homeowners. Programs aimed at renters helped address immediate stability needs, showcasing an understanding of the crisis impacting younger households. Furthermore, while the furlough scheme provided temporary financial relief, the long-term impacts on affordability and market accessibility are yet to be fully addressed.
Practical Implications for Readers
If you find yourself in the 25 to 34 age range, navigating today’s housing environment calls for strategic planning. Consider:
- Saving for a Deposit: Start budgeting early, as high deposits are now more critical than ever.
- Exploring Rental Options: Renting could be a viable short to medium-term strategy while you save and explore different locations.
- Government Programs: Stay informed about local and national initiatives that can assist with down payments or affordable housing options.
Here are some actionable steps you can take:
- Connect with financial advisers to explore boosting your savings towards homeownership.
- Consider co-buying with friends or family to mitigate financial barriers.
- Look into shared ownership schemes that allow for partial ownership while reducing initial costs.
Understanding these demographic shifts in homeownership can empower you to make informed decisions that align with current market realities.