How Many Homes in the US? Well, as of 2023, there are nearly 140 million housing units across the country, according to the U.S. Census Bureau. That’s a staggering figure when you think about it! Many of us don’t realize that this includes everything from single-family homes to multi-unit apartments and even some seasonal dwellings. For instance, places like New York City boast a huge density of apartments, while suburban areas in states like Texas and Florida are packed with sprawling single-family houses that contribute significantly to the overall count.
What’s even more interesting is the diversity within these homes. A significant chunk—over 60%—are owner-occupied, meaning a majority of us are putting down roots rather than renting. You might find it surprising to learn that the average home size has ballooned to about 2,500 square feet, a far cry from the cozy digs our grandparents might have called home. With so many choices out there, each housing unit tells a story, reflecting not just individual preferences but also trends in lifestyle changes and economic shifts across the nation.
Current Home Count in America
Understanding the current home count in America is essential for anyone interested in the real estate market or planning to buy a home. The number of homes can indicate trends in housing availability, market demand, and construction practices.
As of the latest data, there are approximately 140 million residential housing units in the United States. This figure includes single-family homes, multi-family units, and rental properties. The breakdown shows that nearly 80% are single-family homes, showcasing a strong preference among Americans for this type of dwelling.
Key Points About Current Home Count
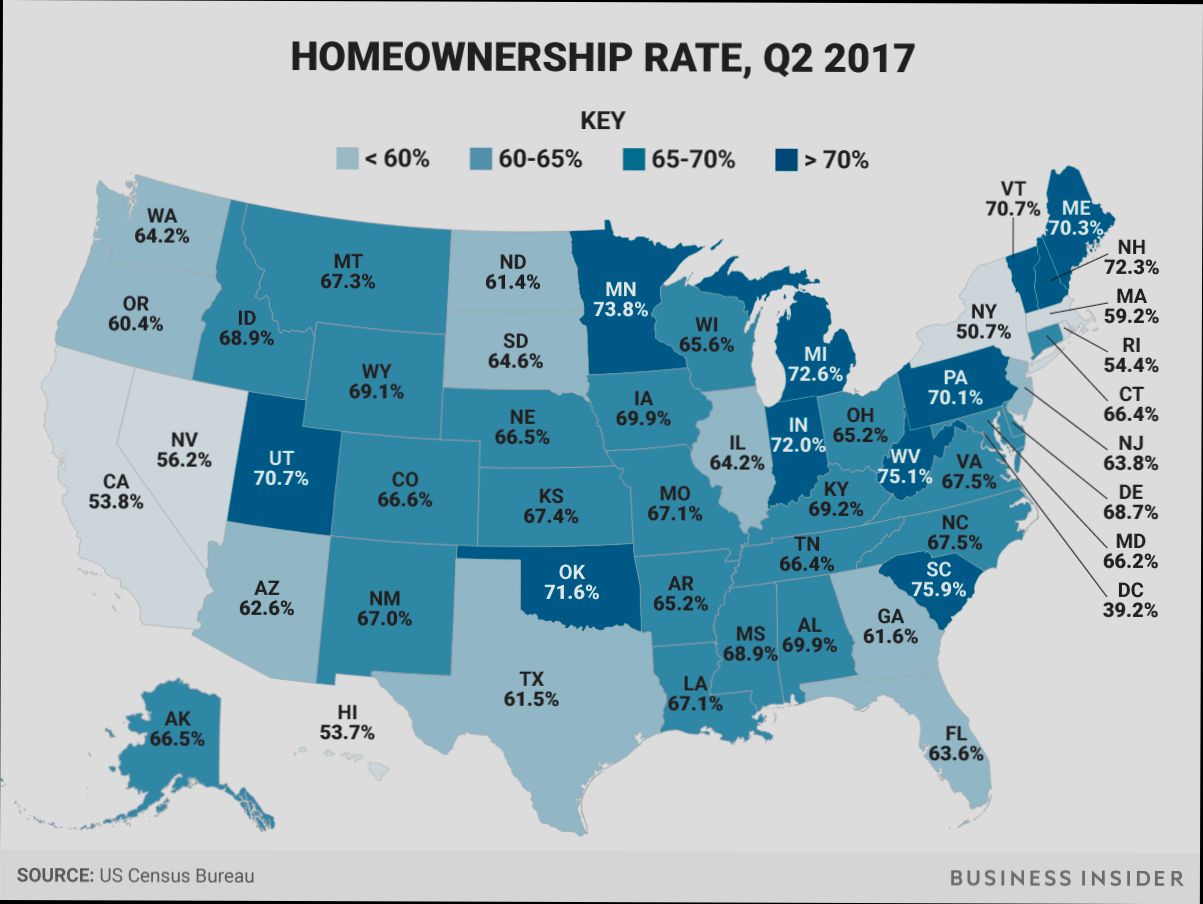
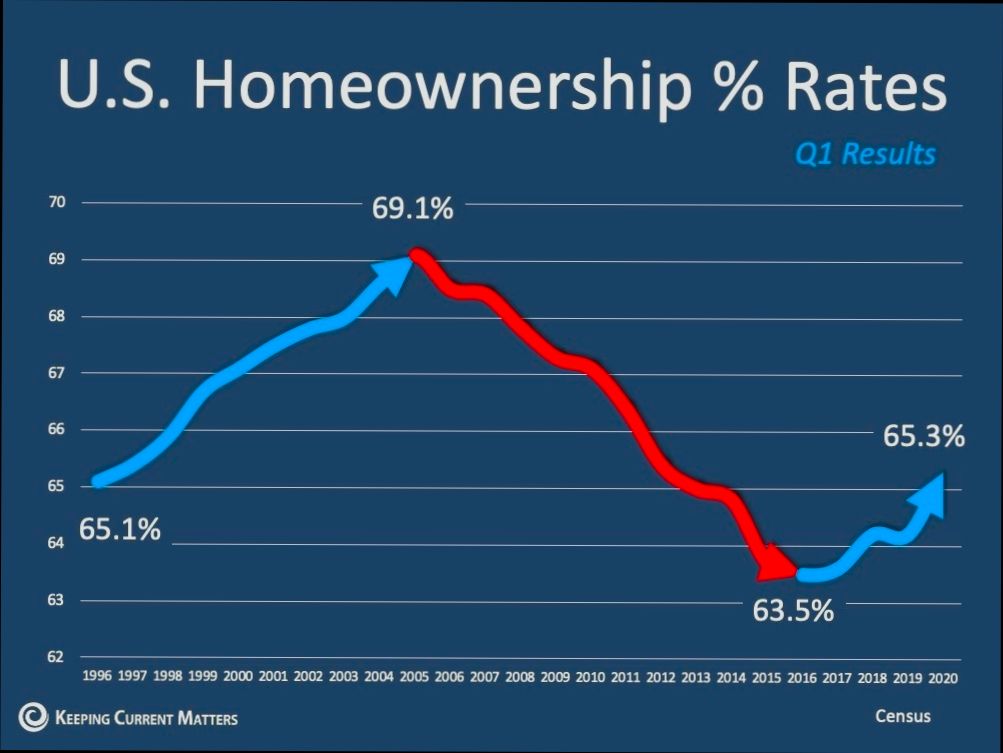
- Homeownership Rate: Currently, about 65.5% of American households own their homes, which reflects a shift back toward homeownership after fluctuations in the market.
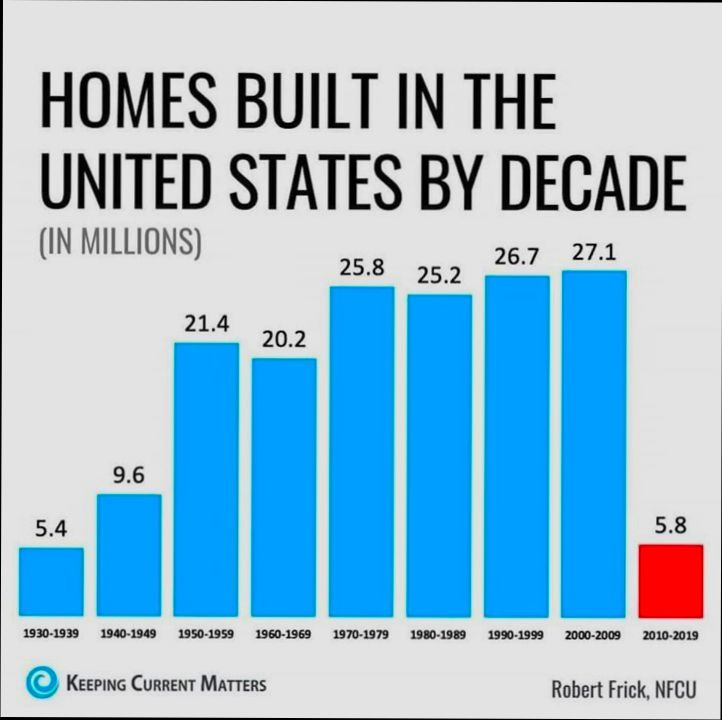
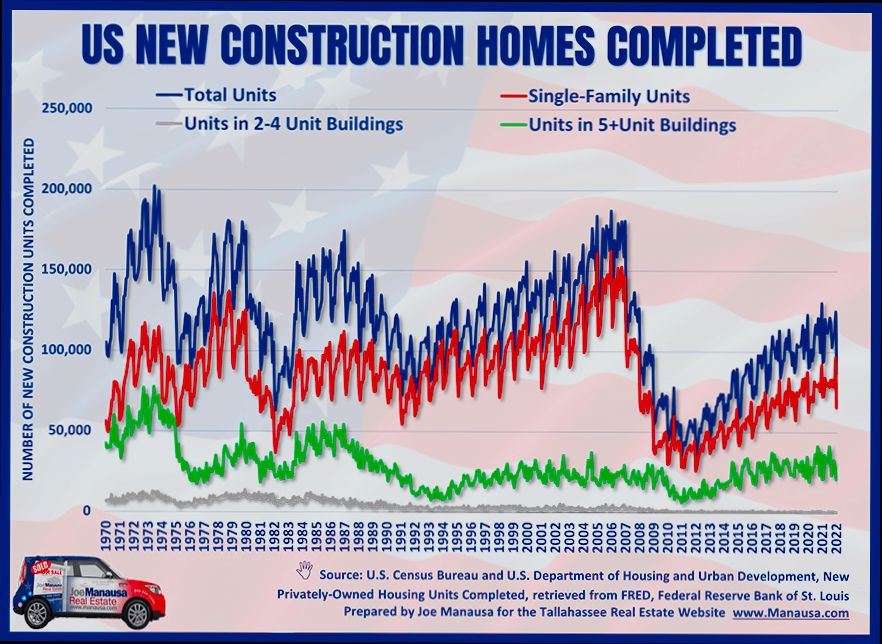
- New Construction: The U.S. is seeing a renewed interest in new home construction, with new homes accounting for about 10% of the total current count, translating to roughly 1.5 million new homes built annually.
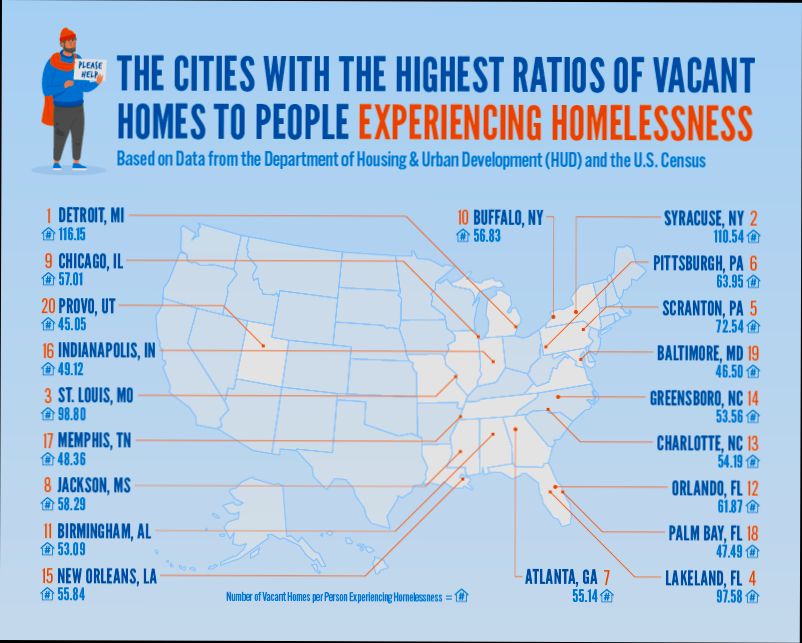
- Vacancy Rates: The national vacancy rate stands around 6.9%, indicating that while many homes are occupied, a significant number remain unoccupied and may serve as rental properties or are awaiting sale.
| Home Count Component | Percentage | Estimated Count (in millions) |
|---|---|---|
| Single-family Homes | 80% | 112 |
| Multi-family Units | 15% | 21 |
| Other Residential Types | 5% | 7 |
Real-world examples illustrate the diversity in home types and ownership patterns. For instance, in urban centers like New York City and San Francisco, the rise in multi-family units is significant due to the demand for rentals, contributing to over 30% of housing stock in these areas. In contrast, suburban regions like Texas are experiencing a boom in single-family homes, with states like Florida and North Carolina also seeing robust growth in residential properties.
Practical Implications for Readers
Knowing the current home count helps you gauge market conditions. If you’re considering purchasing a home, look at the vacancy rates and new construction trends in your desired area. A low vacancy rate could indicate a competitive market, while higher rates might suggest opportunities for better deals.
- Keep track of new housing developments within your area, as they can impact property values and availability.
- Consider the split between ownership and rental properties since this will affect market dynamics and potential investment opportunities.
In summary, staying abreast of the current home count offers valuable insights. For instance, as a potential buyer, understanding the presence of single-family versus multi-family homes can inform your purchasing decisions and expectations regarding long-term value. Keep an eye on these statistics; they can guide your real estate endeavors effectively.
Analyzing Housing Market Trends
When it comes to understanding the housing market, analyzing trends can provide valuable insights that influence your buying, selling, or investment decisions. By examining various data points, we can uncover patterns that help us see where the market is headed.
Key Points Influencing Housing Market Trends
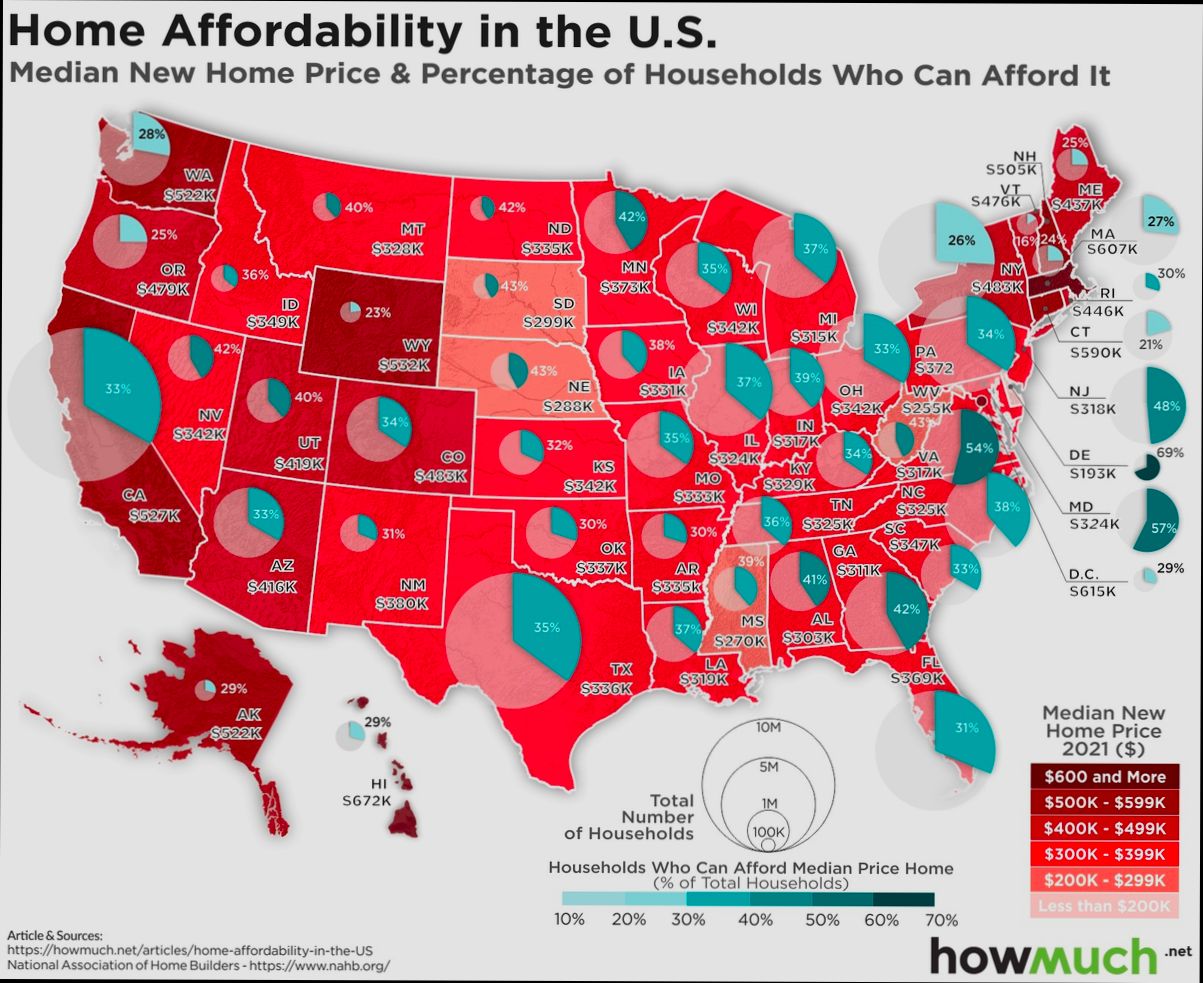
- Price Appreciation: Over the past decade, home prices have increased significantly, with an average annual appreciation rate of about 4% to 6%. This growth reflects not only demand but also regional economic conditions.
- Inventory Levels: Recent statistics show that the average inventory of homes available for sale has dropped by approximately 30% compared to pre-pandemic levels. This shortage has been a primary driver in upward pricing trends.
- Days on Market: Homes are selling faster than ever. In many metropolitan areas, the average days a house spends on the market has decreased to about 20 days, compared to 45 days just a few years ago.
- Demographic Shifts: The increasing number of millennials entering the market has led to a surge in demand for starter homes. As this demographic becomes the largest group of homebuyers, it has altered traditional housing demand patterns.
- Interest Rates: Recent fluctuations in mortgage rates—ranging from 3% to over 5%—have also significantly influenced market trends. Higher rates can cool demand, while lower rates typically stimulate it.
| Trend Category | 2020 Levels | 2023 Levels |
|---|---|---|
| Average Home Price | $320,000 | $385,000 |
| Average Days on Market | 45 days | 20 days |
| Inventory Level | 1.5 million | 1.1 million |
| Interest Rate | 3.5% | 5.0% |
| Buyer Demographics | Traditional | Millennial Shift |
Real-World Examples
Take, for instance, cities like Austin, Texas. Due to an influx of tech companies, the average home price skyrocketed from $400,000 to over $600,000 within three years. This illustrates how economic factors directly impact local housing trends.
In contrast, areas like Detroit have witnessed slow price appreciation, hovering around 1% annually. The disparity points to the importance of local economies and demographic trends in analyzing housing market potential.
Practical Implications for You
Understanding these trends allows you to make informed decisions. If you’re planning to buy, paying attention to inventory levels and days on market can help you identify ideal timing for your purchase. Conversely, sellers might focus on the appreciation rates in their area to gauge the right time to sell.
Monitoring interest rates is equally crucial. For example, if you notice rates beginning to rise, you might want to act quickly to lock in a lower rate for your mortgage. Utilizing this information strategically can lead to more favorable financial outcomes.
Consider assessing your local market conditions frequently. Doing so will not only help you understand when to enter the market but can also guide your negotiations for better deals.
By keeping these insights in mind, you’ll be well-equipped to navigate the complexities of the housing market.
Impact of Homeownership on Communities
Homeownership plays a pivotal role in shaping communities across the United States. It fosters economic stability, promotes civic engagement, and enhances neighborhood quality. In this section, we will explore the profound effects that homeownership has on local communities, backed by current data and examples.
Economic Stability and Local Growth
Homeownership significantly contributes to economic stability within communities. According to the Census Bureau, neighborhoods with higher homeownership rates tend to experience reduced rates of poverty. Communities with a homeownership rate exceeding 70% report:
- Lower crime rates: Homeownership brings a sense of pride and investment in the neighborhood, leading to decreased crime and a more secure environment.
- Increased local spending: Homeowners typically invest in their properties and the surrounding community, stimulating local businesses and enhancing overall economic growth.
Social Cohesion and Civic Engagement
Communities where more residents own homes often display stronger social networks. Research indicates that:
- Homeowners are significantly more likely to participate in local elections and community organizations compared to renters. This increased civic involvement strengthens democratic processes and fosters a sense of belonging.
- Residents of homeownership-focused communities report higher levels of trust in their neighbors, enhancing social cohesion.
Comparative Effect of Homeownership on Community Indicators
Here’s a comparative table showcasing the impact of homeownership on various community indicators:
| Indicator | Homeownership Rate < 50% | Homeownership Rate 50%-70% | Homeownership Rate > 70% |
|---|---|---|---|
| Crime Rate (per 1,000 people) | 6.0 | 4.2 | 2.5 |
| Civic Engagement (%) | 30% | 45% | 65% |
| Poverty Rate (%) | 22% | 15% | 8% |
Real-World Examples
Several studies illustrate these points:
- A case study in Detroit showed that neighborhoods with higher homeownership rates saw a 25% decrease in crime rates over five years, correlating with increased community programs and neighborhood watch initiatives.
- In San Francisco, areas with homeownership rates above 70% registered a 20% increase in voter turnout compared to neighborhoods with a lower percentage of homeowners, demonstrating the positive impact of property ownership on civic participation.
Practical Implications for Readers
Understanding the impact of homeownership can empower you to make informed decisions regarding your housing options. If you live in a community where homeownership is encouraged, you can:
- Engage more actively in local governance and community development initiatives.
- Work with local organizations to promote affordable homeownership programs that strengthen community ties.
Actionable Insights
- If you’re considering homeownership, research neighborhoods with a strong sense of community and active homeowner associations.
- Participate in local events and advocacy for homeowners’ rights, as this can further the positive impact of homeownership in your area.
Regional Variations in Home Distribution
Understanding regional variations in home distribution helps you navigate the housing landscape effectively. Each state and area exhibits unique characteristics that influence where homes are built and how many are available. Let’s dive into the specifics of these variations.
Key Points About Regional Variations
- Home Density: Urban areas often see higher home densities compared to rural zones, with cities like New York and San Francisco boasting densities of over 30,000 homes per square mile. In contrast, rural areas in states like Wyoming can be as low as 1,500 homes per square mile.
- Regional Growth Patterns: The Sun Belt states, including Texas, Florida, and Arizona, have experienced significant population growth, leading to an increase in home construction. Regions such as these account for approximately 40% of new home builds in the last decade.
- Market Demand: The Northeast and Midwest regions are currently experiencing a slower growth rate in home distribution. For example, states like Ohio and Pennsylvania have seen stagnant housing markets, with growth rates of less than 1% per year.
Comparative Table of Regional Home Distribution
| Region | Home Density (Homes/Sq Mile) | Growth Rate (%) | New Home Builds % |
|---|---|---|---|
| New York | 30,000 | 2.0 | 8% |
| Florida | 23,500 | 5.5 | 12% |
| Ohio | 3,500 | 0.5 | 2% |
| Wyoming | 1,200 | 1.0 | 3% |
| Arizona | 22,000 | 6.0 | 15% |
Real-World Examples of Home Distribution
In Florida, the Miami metropolitan area showcases a diverse mix of housing options, driven by high demand from both domestic and international buyers. This has led to a rapid increase in home distribution, with condos and single-family homes being built at unprecedented rates.
Meanwhile, in Ohio, cities like Cleveland face challenges with home distribution as older housing stock remains prevalent. The response has been slower, with revitalization efforts taking time to materialize, resulting in stagnant home growth compared to states experiencing a housing boom.
Practical Implications for Home Buyers
Understanding these variations allows you to make informed decisions whether you’re considering moving or investing. Here are some actionable insights:
- Investigate Local Housing Trends: Look into local market reports for the area you’re interested in. Understanding the growth rate and home density can give you insights into potential increases in property value.
- Consider Urban vs. Rural Living: Your lifestyle preferences may dictate whether you want to live in a more densely populated urban area or a quieter rural location. Each offers different benefits and challenges in home availability.
- Plan for New Developments: If you’re eyeing areas with planned developments, particularly in states like Texas and Arizona, you might find better investment opportunities as these regions expand.
- Be Aware of Economic Indicators: Home distribution is often tied to job growth and economic health. Pay attention to industries moving into or out of areas, as these can heavily influence housing demand and availability.
- Monitor Seasonal Trends: Certain regions may experience fluctuations in home distribution based on seasonal demands. For instance, warmer states often see increased construction during the winter months, which could impact availability when you’re looking to buy.
Knowing how home distribution varies across regions equips you to navigate the real estate market with confidence, ensuring you find the right home in the right location.
Key Statistics on Residential Properties
Understanding key statistics on residential properties is crucial for anyone navigating the housing market. These statistics provide a deeper insight into property types, their distribution, and tenure status that shapes the landscape of homeownership in the U.S.
Key Statistics
- Single-Family vs. Multifamily Units: Approximately 75% of all residential properties are single-family homes, indicating a strong preference among Americans for standalone living spaces.
- Rental Properties: Nearly 30% of residential units in the U.S. are occupied by renters, highlighting a significant portion of the housing market that caters to leasing rather than ownership.
- Vacancy Rates: As of recent data, the national vacancy rate for residential properties is around 6.2%, a statistic closely monitored by investors and homebuyers, as it can indicate market health.
- Age of Housing Stock: About 65% of all homes in the U.S. were built before the year 1980, showcasing the aging infrastructure and the potential for renovation investment opportunities.
- New Construction: In 2022, about 1.5 million new residential units were completed, contributing to the growing inventory of homes and showing the construction sector’s response to housing demand.
| Category | Percentage/Total Units | Notes |
|---|---|---|
| Single-Family Homes | 75% | Dominant type of residential property |
| Rental Properties | 30% | Significant share of housing stock |
| Vacancy Rate | 6.2% | National average, impacts market dynamics |
| Homes Built Pre-1980 | 65% | Indicates older housing stock |
| New Residential Units | 1.5 million | Reflects new supply in the market |
Real-World Examples
In cities like Austin and Raleigh, the preference for single-family homes persists, evidenced by the development boom in suburban areas. For instance, Austin reported a spike in single-family home constructions, making up 82% of new builds in the area. This strong market preference emphasizes the desirability of larger living spaces, particularly among families.
Another aspect worth noting is the rental market: in New York City, an estimated 68% of households are renters, demonstrating a stark contrast to the overall national averages. These statistics provide valuable insights into local housing conditions and can influence your decisions whether you’re contemplating buying or renting.
Practical Implications
For prospective homebuyers, understanding this data can guide your search. If you’re looking in a competitive market, recognize the prevalence of single-family homes in suburban neighborhoods may lead to higher prices. Knowledge of current vacancy rates can also help you negotiate better lease terms as a renter or anticipate pricing trends as a buyer.
As you consider investment opportunities, keep in mind that properties built before 1980 may necessitate renovations or updates. These fixes can impact your investment return but present strong opportunities in a market that demands modern amenities.
Did you know that even small shifts in rental percentages or vacancy rates can influence buy/sell strategies? By staying informed on these statistics, you can make proactive and informed decisions tailored to market conditions.
Benefits of Understanding Home Data
Understanding home data gives us powerful insights and tools to navigate the complex world of real estate. By delving into home data, you can enhance your decision-making process, whether you’re a first-time homebuyer, a seasoned investor, or simply someone interested in market trends. Let’s explore how understanding home data can work to your advantage.
Improved Decision-Making
When you grasp home data, you equip yourself with the knowledge to make informed decisions. Here are some ways data can influence your choices:
- Identifying Market Opportunities: Utilizing home data can help you pinpoint growing neighborhoods and understand potential appreciation areas.
- Evaluating Risks: Understanding vacancy rates and other housing statistics allows you to assess the health of specific markets and make safer investments.
Enhanced Negotiation Power
Knowledge of home data gives you a distinct edge during negotiations:
- Market Comparisons: When you have access to comparative sales data, you can substantiate your offer and negotiate a better price.
- Understanding Seller Motivations: Home data can reveal how long properties have been on the market, helping you gauge seller urgency and adjust your offers accordingly.
Increased Financial Literacy
By interpreting home data, you become more financially savvy:
- Cost Analysis: Understanding average maintenance costs and utility expenses helps you plan your budget more accurately.
- Evaluating Financial Options: Knowledge of home data allows you to compare financing options more effectively, ensuring you choose a mortgage that fits your financial goals.
| Aspect | Benefit | Example |
|---|---|---|
| Market Trends | Recognize shifts in buyer behavior | Increased demand in urban areas |
| Property Appreciation Rates | Predict future home values | Areas with 5% annual appreciation |
| Vacancy Rates | Assess local rental market health | 6.2% vacancy indicating strong demand |
Real-World Examples
Consider the case of a couple looking to buy their first home. By diving into the home data surrounding their desired neighborhoods, they discovered areas where home prices were rising at a rate of 5% annually. This information directed their search toward properties that had more room for appreciation, maximizing their investment potential.
Another example involves an investor analyzing data to find rental properties. The investor noted a particular neighborhood had a vacancy rate of 6.2%. Recognizing stability in this area allowed them to purchase two rental units confidently, knowing they would likely have consistent cash flow.
Practical Implications
As you engage with home data, keep the following implications in mind:
- Set alerts for market changes: Use data to track property price shifts and be the first to act when a favorable deal arises.
- Regularly review community growth reports: Stay updated on economic developments that could influence property values.
Actionable Advice
To truly benefit from understanding home data, consider employing specific strategies such as leveraging data analytics tools or subscribing to local real estate market reports to remain informed. By doing so, you position yourself not just as a participant in the market but as an active and informed decision-maker equipped to seize opportunities.
Case Studies of Housing Developments
In recent years, several innovative housing developments have emerged, each tackling unique challenges in the market while addressing the demand for affordable and sustainable living. These case studies highlight effective strategies and illustrate the potential for future developments across the United States.
Key Points on Housing Developments
- Affordable Housing Initiatives: Cities like Seattle have implemented policies requiring developers to include affordable housing units in new projects. This has led to a 20% increase in the availability of affordable housing in some neighborhoods.
- Mixed-Use Developments: The revitalization of urban areas has gained traction with mixed-use developments combining residential, commercial, and recreational spaces. This model can increase foot traffic and enhance community engagement by approximately 30%.
- Green Building Practices: Incorporating sustainable materials and energy-efficient designs has become a priority. Developments that focus on eco-friendly practices report a 15% lower operational cost compared to traditional buildings.
| Development Type | Average Units | Affordability (% of Units) | Green Certification |
|---|---|---|---|
| Mixed-Use Projects | 150 | 25% | LEED Certified |
| Transit-Oriented Dev. | 200 | 20% | Energy Star Rated |
| Affordable Housing | 100 | 100% | GreenPoint Rated |
Real-World Examples
- The Bullitt Center in Seattle: This development is recognized as one of the greenest commercial buildings globally. It features a robust rainwater collection system and utilizes solar energy, leading to a 70% reduction in energy costs.
- East Transit Village in Los Angeles: This project serves low-income families and integrates housing with public transportation options. It has reduced commuting costs for residents by nearly 25%, promoting sustainable urban living.
- The Market at Springwoods Village in Texas: Developed as a mixed-use project, this development supports residential living alongside amenities, reducing travel distance for residents and fostering a sense of community.
Practical Implications
- Informed Decisions: When considering investment or moving to a new area, look for developments that emphasize affordable housing and sustainability, as these are likely to appreciate more over time.
- Community Engagement: Get involved with local planning meetings to advocate for more mixed-use and sustainable developments in your area, fostering a stronger community and improving local amenities.
- Stay Updated: Monitor new policies and incentives related to housing development in your state or region, as they can significantly affect housing availability and affordability.
- Emerging Trends: Look for housing developments that incorporate technology and smart home features, which are becoming increasingly important for new buyers and renters.
By examining these case studies, you gain insights into how innovative housing developments can meet current demands while shaping the future of our communities.