How Much House Can I Afford Making $45,000 a Year in the United States? If you’re in the $45,000 club, you might be eyeing cozy two-bedroom homes or even a stylish condo in a lively neighborhood. With the median home price hovering around $400,000 in many parts of the country, understanding your budget is crucial. Using the general rule of thumb suggesting that your monthly housing costs should not exceed 28% of your gross income, you’re looking at about $1,050 a month. But don’t get too excited just yet; reality can vary widely based on where you’re shopping for a home.
Think about it—if you live in a city with a sizzling housing market like Boston or San Francisco, you might find yourself up against some stiff competition. A charming starter home could easily stretch your budget, forcing you to consider small towns or areas with lower-cost living. On the flip side, places in the Midwest like Ohio or Indiana could snag you a decent property well within your range. So, how do you make the numbers work without getting overwhelmed by the complexity of mortgages, down payments, and all those extra costs? It’s all about finding the right balance between your aspirations and what your paycheck can realistically support.
Understanding Mortgage Affordability Criteria
Navigating the world of mortgages can feel overwhelming, especially when trying to understand what you can truly afford. In this section, we’ll break down the essential mortgage affordability criteria to help you make informed decisions about buying a home within your means.
Key Affordability Metrics
When peering into mortgage affordability, it’s crucial to grasp key metrics that help determine how much house you can afford:
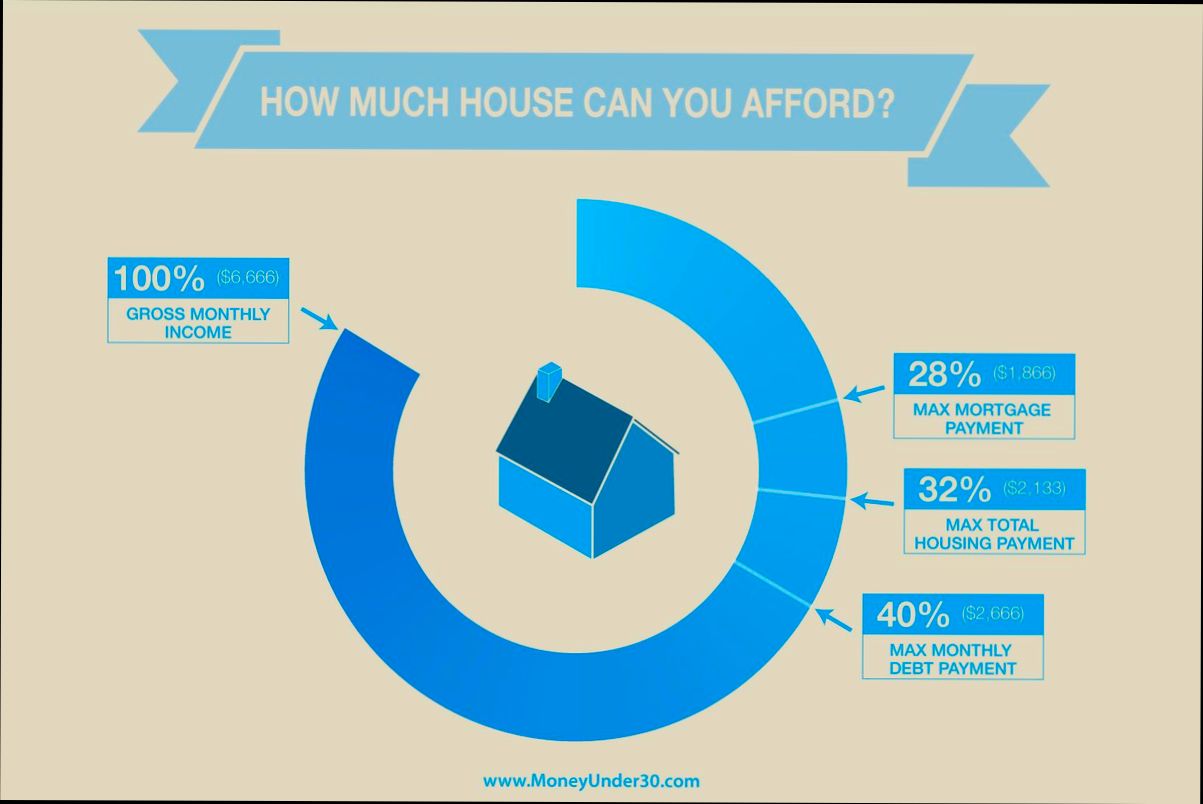
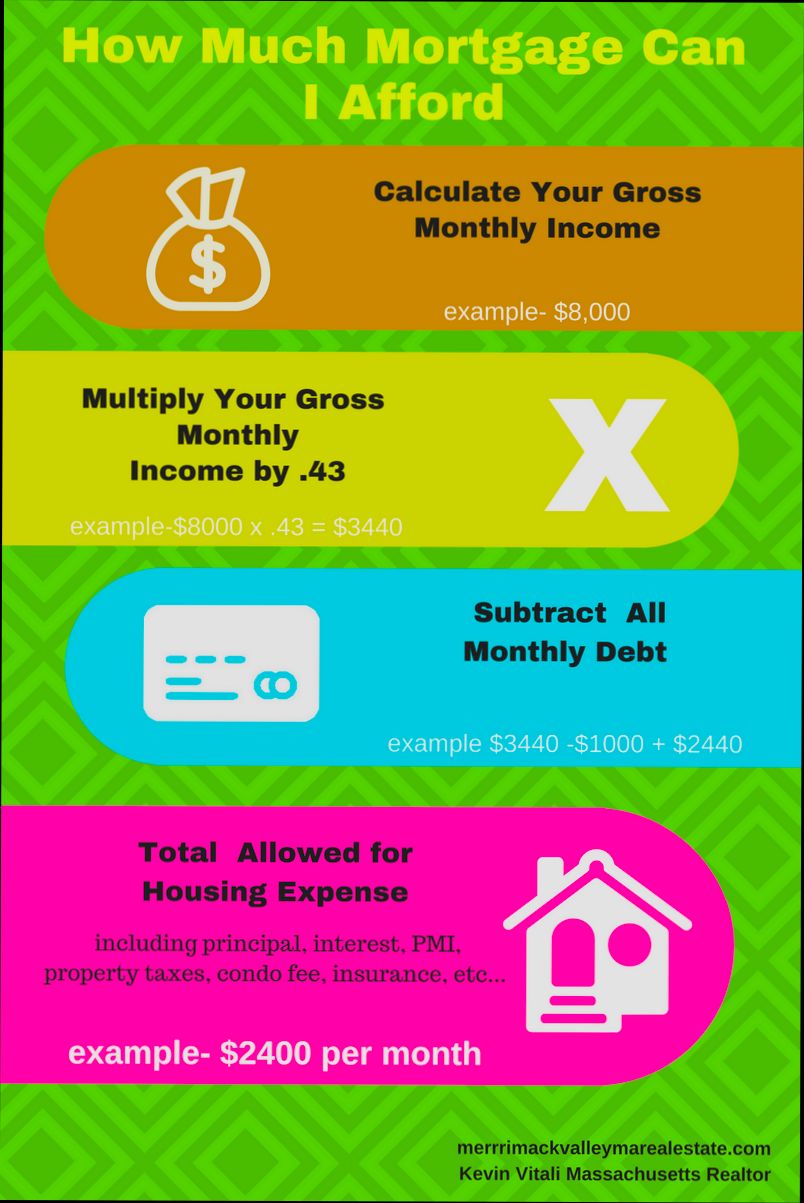
- 28/36 Rule: This rule suggests that your housing expenses should ideally not exceed 28% of your gross monthly income. Additionally, your total debt payments, including any loans or credit card debts, should stay below 36%.
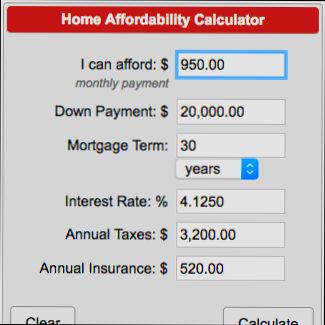
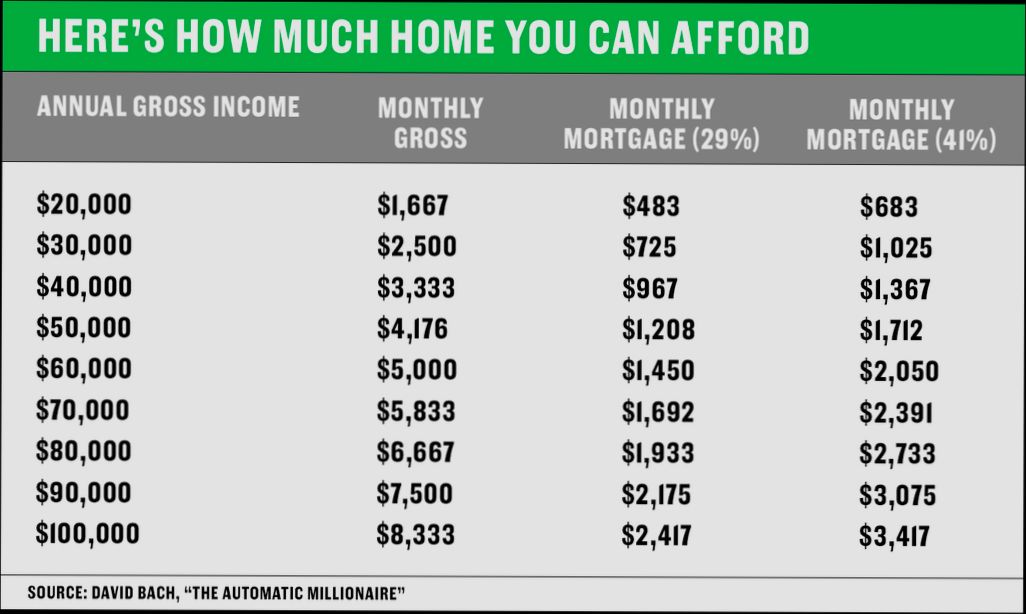
- Monthly Payment Calculation: If you earn $45,000 a year, this breaks down to approximately $3,750 per month before taxes. Following the 28% rule, you should aim for a mortgage payment of around $1,050. Including other debts, your total payments should remain under $1,350 to keep within the recommended 36% threshold.
- Down Payment Requirements: Most lenders require a down payment that fluctuates between 3% and 20% of the home’s price. For first-time homebuyers or those with good credit, some loans might even offer zero down payment options, but it’s essential to be aware of your credit score as it influences the amount you must put down.
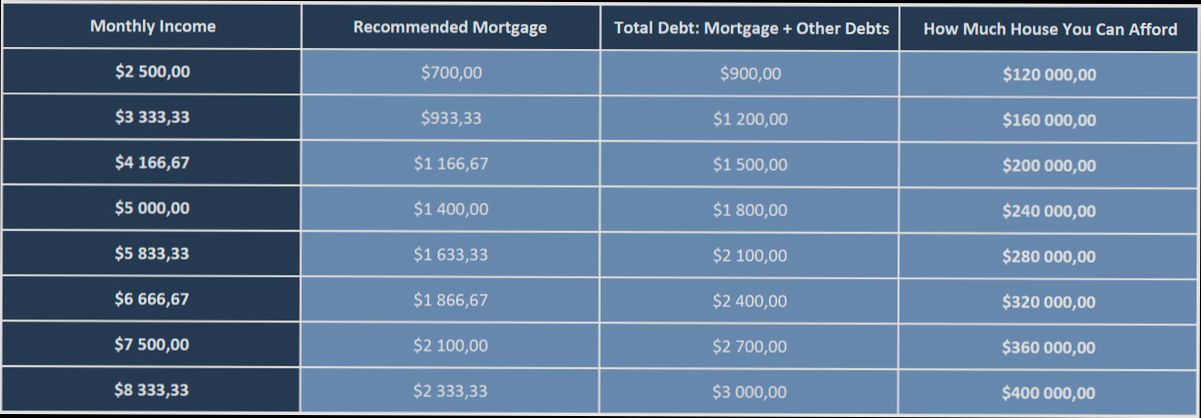
Comparison of Monthly Costs Based on Earnings
| Monthly Income | 28% Housing Cost | 36% Total Debt Cost |
|---|---|---|
| $3,750 | $1,050 | $1,350 |
| $4,500 | $1,260 | $1,620 |
| $5,000 | $1,400 | $1,800 |
Real-World Example
Let’s consider a real scenario. Suppose you have a total gross annual income of $45,000, translating to approximately $3,750 each month before deductions. According to the 28% rule, your target housing cost should be around $1,050 monthly. Let’s say you have an existing car loan of $250 per month and a credit card payment of $150 per month. Your total monthly debt would then equal $1,450, exceeding the ideal 36% guideline for total debt payments.
To bring this back into line, you could look into paying off the credit card debt or consider a less expensive home that reduces your monthly mortgage payment.
Practical Implications for Homebuyers
Understanding these criteria is not just about theoretical knowledge; it’s about applying this information to your financial reality:
- Documentation: Be prepared to provide comprehensive documentation of your income, expenses, and credit history. Lenders will look at your income sources, which include pay slips, bank statements, and tax returns.
- Improving Eligibility: If you find yourself on the edge of the affordability spectrum, consider steps like improving your credit score, reducing existing debts, and saving for a larger down payment.
- Consulting a Broker: Engaging a mortgage broker can help simplify the process. They can guide you in navigating complex calculations and finding lenders who may offer more favorable terms.
- Stay Informed: Keep up with mortgage rates and trends. Sometimes waiting for a better market condition can significantly affect what kind of home you can afford.
By being aware of these affordability criteria and actively managing your financial situation, you can set yourself up for success in your home-buying journey.

Analyzing Costs Beyond the Purchase Price
When considering how much house you can afford, it’s crucial to look beyond the purchase price. Buying a home involves a range of additional costs that can significantly impact your financial situation. Let’s break down these costs and see how they play a role in your affordability, especially if you’re making $45,000 a year.
Understanding the Additional Costs
Buying a home includes several expenses beyond just the mortgage payment. Here’s a closer look:
- Property Taxes: These can vary widely depending on your location. Typically, property tax rates are around 1% to 2% of the home’s assessed value. For example, if your new home is priced at $200,000, you might pay anywhere from $2,000 to $4,000 annually.
- Homeowner’s Insurance: This coverage protects your home from damages and liabilities. The average cost is about $1,000 to $1,500 per year. This will need to be factored into your monthly budget as well. If you divide $1,200 a year by 12 months, that’s an additional $100 a month.
- HOA or Co-op Fees: If your home is part of a community, you might be subject to additional fees for maintenance and amenities. This can range from $200 to $400 monthly in many neighborhoods. It’s important to inquire about these fees before committing.
- Maintenance and Repairs: A good rule of thumb is to allocate about 1% of your home’s purchase price annually for maintenance. If you’re purchasing a $200,000 home, set aside $2,000 a year or about $167 monthly for upkeep.
Monthly Cost Breakdown
Here’s a comparative table that outlines potential monthly costs, helping you visualize the overall expenditure when buying a $200,000 home.
| Cost Component | Estimated Monthly Cost | Annual Cost |
|---|---|---|
| Principal & Interest | $800 | $9,600 |
| Property Tax | $300 (1.5% annual) | $3,600 |
| Homeowner’s Insurance | $100 | $1,200 |
| HOA Fees | $300 | $3,600 |
| Maintenance | $167 | $2,000 |
| Total Monthly Cost | $1,667 | $20,000 |
Real-World Example
Let’s consider a family looking to buy a home. They find a $200,000 house and fall in love. However, they must recognize the costs beyond the purchase price. With a mortgage of $800 a month, plus $300 in property taxes, $100 in insurance, and $300 for HOA fees, their total monthly costs come to about $1,667. With an annual income of $45,000, their debt-to-income (DTI) ratio is approaching the acceptable limits.
- Scenario 1: If the family reduces their other debts to ensure their DTI ratio falls below 36%, they will need to eliminate at least $200 from their existing monthly obligations.
- Scenario 2: Alternatively, increasing their down payment to 20% (from 3%) can lower their monthly mortgage payments, freeing up budget for those additional costs.
Practical Insights for Buyers
As you consider how much house you can afford, remember these actionable steps:
- Itemize your costs: Create a detailed list of all potential costs associated with homeownership, including property taxes, insurance, and maintenance.
- Negotiate: Explore options to negotiate lower HOA fees or get better rates on insurance.
- Budget Wisely: Keep a cushion in your budget for unforeseen costs, which can save you from financial distress later on.
Additional Key Facts
- A solid plan for your monthly budget should include not just the mortgage but all the associated costs, which can cumulatively impact your affordability.
- Familiarize yourself with local tax rates and HOA fees, as these can vary significantly by region.
- Maintain a strong credit score to secure better mortgage rates, which directly affect your monthly payment capabilities.
By understanding and analyzing these additional costs, you can make a more informed decision about your home-buying journey and what you can truly afford on a $45,000 annual salary.
Real-World Scenarios for $45000 Incomes
When you’re earning $45,000 a year, understanding how that income translates into purchasing a home is crucial. Let’s explore realistic scenarios showcasing what potential homeowners can expect regarding affordability, geographical differences, and the impact of living expenses.
Key Points to Consider
- Monthly Income: At $45,000 annually, your gross monthly income is about $3,750. Following general lending guidelines, you might allocate around $1,050 to housing costs if you stick to the 28% rule.
- Housing Market Variability: Depending on where you live, housing costs can significantly differ. In some parts of the country, this allocation will afford a modest home, while in others, it might only cover rent. For instance, the median home price in cities like Nashville is approximately $450,000, making it unfeasible for someone with a $45,000 income.
- Debt-to-Income Ratio: While the recommended debt-to-income ratio is 36%, those earning $45,000 may be unable to afford a large mortgage if they have existing student loans or credit card debt. If you have $300 monthly in student loans, your available housing budget shrinks to about $900.
Comparative Table of Housing Affordability by Location
| Location | Median Home Price | Monthly Housing Budget | Action for Income Level |
|---|---|---|---|
| Nashville, TN | $450,000 | $1,050 | Rent or consider nearby suburbs |
| Columbus, OH | $290,000 | $1,050 | Afford a modest home |
| Phoenix, AZ | $410,000 | $1,050 | Likely requires compromise |
| Pittsburgh, PA | $230,000 | $1,050 | Can buy a family home |
| Raleigh, NC | $350,000 | $1,050 | Limited options available |
Real-World Examples
1. City Dweller Scenario: A single professional living in Los Angeles earning $45,000 finds it challenging to enter the housing market. With a high cost of living, they determine that renting a studio apartment for $1,800 is more feasible than purchasing a home. This individual opts for a roommate to split costs.
2. Family Focus: A family of four in Pittsburgh makes a combined $45,000, where the local median home price is around $230,000. They secure a mortgage with assistance from first-time buyer programs, allowing them to afford a two-bedroom home by maximizing their monthly budget and reducing discretionary spending.
3. Young Couple in Phoenix: A couple with a combined income of $45,000 considers starting a family. Although houses in Phoenix are priced around $410,000, they choose to focus on smaller towns within commuting distance, where they can purchase a starter home for approximately $250,000, creating a more sustainable financial outlook.
Practical Implications
- Research your local real estate market: Before you house hunt, understand local prices versus your potential mortgage budget.
- Consider additional expenses: Always factor in repairs, monthly bills, and maintenance when evaluating what you can afford. You might find that a $1,050 monthly budget could stretch only so far once you account for property taxes or homeowner association fees.
- Keep future goals in mind: Think about your lifestyle and whether a home purchase aligns with your financial goals. If you anticipate job changes or expanding your family soon, consider that flexibility may be necessary.
- Explore specific loan options: First-time buyer programs, VA loans, or USDA loans might provide pathways to affordable homeownership, even at a $45,000 income level.
Understanding these real-world scenarios can better equip you for the housing market. Stay informed about your options to make the best decision for your circumstances.
Key Financial Ratios for Home Buying
When it comes to buying a home, understanding key financial ratios is essential to determining how much house you can afford. These ratios not only guide your budget but also influence lender decisions, ensuring that you’re on solid financial footing throughout the buying process. Let’s explore some critical financial ratios to consider as you navigate your home buying journey.
Understanding Key Financial Ratios
1. Debt-to-Income (DTI) Ratio
- The DTI ratio measures your monthly debt payments against your gross monthly income. Lenders typically prefer a DTI of 36% or lower, but a maximum allowable ratio of 43% may grant you access to a broader range of loan options.
- For example, if you earn $45,000 annually, your gross monthly income is approximately $3,750. This means your total monthly debt payments should ideally be below $1,350 at a 36% DTI (0.36 x $3,750).
2. Housing Expense Ratio
- Also known as the front-end DTI, this ratio compares your housing expenses to your gross monthly income. It’s advisable to keep these expenses below 28% of your gross monthly earnings.
- In tangible terms, this would mean allocating no more than $1,050 for your monthly housing costs (0.28 x $3,750). This includes your mortgage payment, property taxes, homeowners insurance, and any applicable HOA fees.
3. Loan-to-Value (LTV) Ratio
- The LTV ratio compares the amount of your mortgage against the appraised value of the home. A lower LTV ratio indicates less risk to the lender. Typically, lenders prefer an LTV ratio of 80% or lower to avoid Private Mortgage Insurance (PMI).
- For example, if you’re purchasing a $200,000 home, you would need at least a $40,000 down payment (20%) to achieve that 80% LTV ratio.
Comparative Table of Key Ratios
| Ratio | Ideal Percentage | Maximum Allowable Percentage |
|---|---|---|
| Debt-to-Income (DTI) | 36% | 43% |
| Housing Expense Ratio | 28% | N/A |
| Loan-to-Value (LTV) | 80% | 95% with PMI |
| Minimum Credit Score | 620 | N/A (for conventional loans) |
Real-World Example of Financial Ratios
Consider a single individual making $45,000 a year. If debts (like student loans and credit cards) total $300 monthly, their DTI would look like this:
- Gross Monthly Income: $3,750
- Total Monthly Debt Payments: $300
- DTI Calculation: (300/3750) = 8%
Since this DTI (8%) is well below the ideal threshold, this person might qualify for a larger mortgage.
Alternatively, suppose they want to purchase a home for $200,000 and make a 10% down payment of $20,000. Their LTV would be calculated as follows:
- Loan Amount: $180,000
- Home Value: $200,000
- LTV Calculation: (180,000/200,000) = 90%
This higher LTV means they may be required to pay PMI unless they can negotiate a better down payment.
Practical Implications
Understanding these financial ratios allows you to frame your budget accurately while communicating effectively with potential lenders. By controlling your DTI and maintaining a favorable LTV ratio, you can significantly enhance your chances of mortgage approval. Also, focusing on improving your credit score and savings for a larger down payment can substantially boost your overall buying power.
Actionable Advice
To optimize your financial ratios, consider these steps:
- Pay down existing debts to improve your DTI ratio.
- Save aggressively for your down payment to achieve a better LTV and avoid PMI.
- Check your credit report for errors and rectify them to improve your credit score, which directly influences your interest rates and loan approval.
Exploring Local Housing Market Trends
When you’re assessing how much house you can afford, it’s essential to dive into local housing market trends. Understanding these dynamics can help you identify affordable options and navigate the complexities of home purchasing in your area.
Housing inventory can significantly impact home affordability. As of the second quarter of 2024, new construction accounted for about 30% of overall housing inventory, indicating a growing segment of the market that could provide more choices for potential buyers. This is especially vital considering the estimated pent-up demand for up to 4.5 million homes across the nation, suggesting more options could soon be available.
Current Market Dynamics
1. Interest Rates: Almost 86% of homeowners with mortgages enjoy rates below 6%, but fluctuations in these rates could affect affordability for new buyers.
2. Housing Starts: After peaking at over 1.5 million in 2022, housing starts have recently stabilized, indicating a leveling off that could influence future availability and pricing.
3. Demand vs. Supply: A limited inventory of existing homes has pushed many buyers toward new builds, which may fill significant gaps in supply, particularly if builders help mitigate mortgage rates.
| Feature | Current Status | Implications |
|---|---|---|
| Percentage of New Inventory | 30% | Provides options for new buyers |
| Estimated Housing Shortage | Up to 4.5 million homes | Indicates strong competition ahead |
| Mortgage Rates | 6% to 7% (expected) | Affects purchasing power |
| Average Home Sales Growth | Moderate | Adjusts expectations for pricing |
Real-World Examples
For instance, in areas where housing starts have increased, like many regions across the Midwest, we’ve seen a rise in newly constructed homes that cater to diverse buyer needs. These newly built residences are becoming more prevalent as buyers adjust to higher mortgage costs, thereby positioning newly constructed homes as attractive alternatives.
Additionally, as buying habits adjust to regional trends, many buyers in the Southern states are finding homes in homeowners associations (HOAs) — which currently govern about 30% of residences. This trend offers additional amenities but often comes with monthly fees that impact affordability.
Practical Considerations for Buyers
As you explore local housing market trends, keep in mind the following actionable insights:
- Monitor Inventory: Track local housing inventory changes over the months, as this can help predict pricing shifts.
- Understand Construction Trends: Pay attention to areas with higher housing starts and new builds; they might offer competitive pricing compared to existing homes.
- Focus on Financial Readiness: As market conditions evolve, preparing financially — reducing debt and possibly increasing your credit score — becomes crucial to ensuring you can act quickly when you find a suitable home.
Specific Facts to Remember
- Rising mortgage rates could lead to temporary slowdowns in home buying, making it crucial for interested buyers to keep abreast of rate trends and market forecasts.
- Areas with burgeoning housing supply will often see better price stabilization—a factor to consider if you are planning to make an offer within the next year.
Unlocking the intricacies of your local housing market could be the key to finding a home that fits your budget while strategically leveraging market trends to your advantage.

Benefits of Homeownership on a Budget
Homeownership offers numerous advantages, even for those of us working within a limited budget. With careful planning and consideration, owning a home can enhance your financial stability, create a sense of community, and lead to long-term wealth accumulation.
Financial Stability and Predictability
One significant benefit of owning a home is the financial predictability it provides. Unlike renting, where you might face annual rent increases, a fixed-rate mortgage ensures your monthly payment remains stable over time. This stability allows you to budget more effectively.
- Potential for Increased Equity: As you pay down your mortgage, you build equity. On average, homeowners see their equity grow by about 3-5% annually, depending on the housing market.
- Tax Deductions: Homeowners can often deduct mortgage interest and property taxes, which may amount to significant savings. In 2021, for example, homeowners on average saved nearly $1,000 through the mortgage interest deduction.
Community and Personal Investment
When you buy a home, you often become part of a community, which can lead to a greater sense of belonging and increased civic engagement.
- Home Values and Neighborhood Growth: Studies show that homeowners are more likely to invest in their neighborhoods, potentially leading to increased property values. A report indicated that neighborhoods with a higher percentage of homeowners saw property value increases of up to 10% over a five-year span.
Cost Comparisons: Renting vs. Owning
To illustrate the potential savings and investment benefits, consider the table below comparing typical costs associated with renting versus owning on a budget:
| Cost Type | Renting (Monthly) | Owning (Monthly) | Potential Savings |
|---|---|---|---|
| Rent Payment | $1,200 | $1,000 | $200 in monthly housing costs |
| Utilities | $150 | $180 | $30 higher in utility costs |
| Property Taxes | N/A | $100 | Cost factored into ownership |
| Maintenance & Repairs | N/A | $100 | Considered an investment in value |
Real-World Examples
Let’s explore the story of Jessica, a single mother making $45,000 a year. After carefully assessing her budget, she purchased a modest home for $175,000.
- By opting for a 30-year fixed mortgage, her total payment (including taxes and insurance) came to around $1,200 per month. In contrast, her local rental market required $1,350 for a comparable apartment.
- Over five years, Jessica built approximately $20,000 in equity as she paid down her mortgage, contributing to her financial security.
Another example features Alex, who also earns $45,000. He decided to buy instead of rent, taking advantage of first-time homebuyer assistance programs.
- By successfully budgeting for his mortgage, he enjoys a stable monthly cost while accumulating wealth through his home. Alex discovered that homeowners in his neighborhood appreciated their property values by nearly 12% over five years, enhancing his investment further.
Practical Implications for Budget-Conscious Buyers
Here are some actionable steps you can take to leverage the benefits of homeownership on a budget:
- Explore First-Time Buyer Programs: Many states offer grants and low-interest loans that could significantly reduce your upfront costs.
- Consider FHA Loans: These loans allow you to buy with a lower down payment, sometimes as low as 3.5%. This could make homeownership more accessible.
- Stay Informed About Local Markets: Understanding housing trends in your area can help you find properties that are undervalued but have the potential for appreciation.
To summarize, owning a home on a budget not only offers financial stability but also enhances your sense of community while building a foundation for long-term wealth. As you explore your options, consider the tangible and intangible benefits that align with your financial goals.
Statistical Overview of Income and Housing Affordability
Understanding the relationship between income and housing affordability allows you to make more informed decisions when considering homeownership, especially when working with a salary of $45,000 a year. A statistical overview reveals how income levels align with housing costs across different regions.
Key Income and Housing Affordability Statistics
1. Affordability Thresholds: Nationally, homes should ideally cost no more than 2.6 times your annual income. For someone earning $45,000 a year, this translates to a maximum home price of approximately $117,000.
2. Geographic Variations: According to recent data, housing affordability varies significantly by state. In states like Ohio and Pennsylvania, the average home price is around $150,000, while in states like California, it can soar to over $800,000.
3. Income vs. Housing Cost: The median home price in the U.S. stands at about $400,000. This means that approximately 69% of American households would struggle to purchase this median-priced home if we consider income levels and typical financing options.
4. Rising Housing Costs: In a recent report, it was noted that housing costs have risen by an average of 15% over the past three years in urban areas, greatly affecting low and middle-income earners.
5. Homeownership Rates: Currently, approximately 64% of families earning $45,000 or less own their homes, as opposed to 81% of families earning over $100,000. This demonstrates the challenges faced by those with lower incomes.
| Category | Average Income | Average Home Price | Max Affordable Home Price (2.6x Income) | Percentage of Homeownership |
|---|---|---|---|---|
| National Average | $67,000 | $400,000 | $174,200 | 64% |
| California | $75,000 | $800,000 | $195,000 | 55% |
| Ohio | $45,000 | $150,000 | $117,000 | 76% |
| Pennsylvania | $55,000 | $200,000 | $143,000 | 70% |
Real-World Examples Illustrating Income and Housing Affordability
- Ohio: A family of four earning $45,000 can afford a home priced around $117,000. According to local listings, this aligns with properties available in suburban areas, reinforcing the idea that certain regions offer more affordable options.
- California: In major cities like Los Angeles, the median home price far exceeds $800,000. Families earning $45,000 typically cannot afford to enter this market, leading many to rent instead, which can consume upwards of 50% of their income.
- Pennsylvania: In cities like Pittsburgh, there are neighborhoods where families earning $45,000 can purchase homes for around $150,000. This scenario showcases a relative affordability in comparison to the state average, allowing families to achieve homeownership.
Practical Implications for Housing Affordability
- Legislative Impact: Policies aiming to enhance affordable housing development can help bridge the gap for low-income earners, potentially increasing homeownership rates among families making $45,000 yearly.
- Budget Management: As you consider purchasing a home, it’s essential to create a comprehensive budget that emphasizes not just the mortgage payment but all related costs, including maintenance and utilities.
- Counseling Resources: Utilizing housing counseling services can guide you through affordable options in your area, providing you with tailored knowledge based on income and housing market conditions.
- Community Integrity: Buying a home needs to align with job stability and community needs. When considering your options, evaluate whether a home purchase enhances your long-term financial strategy.
Investing time in understanding the statistical landscape of income and housing affordability, particularly within the context of your unique financial situation, can empower you to make more sound housing choices.